


HIES 2016 DIARIES
HIES 2016
DIARIES
As discussed in the introduction, the sample was selected randomly, with an effort to obtain about 10 percent of the units on Saipan and about 20 percent of the units on Tinian and Rota. Also, as noted, it is almost impossible for a survey to obtain the full sample, so survey and census operations usually over-sample. But the CNMI initial samples were so large, that they were not over-sampled (since they were over-sampled compared to other countries in the first place.) The numbers of households responding to the regular questionnaire appear in the discussion above.
Filling the diaries is very time consuming and intrusive, so we always expect that many of the units will refuse to assist in the data collection. So, as expected, this was the case in the CNMI Household Survey. Altogether, 864 households filled diaries sufficiently (daily and completely) to be included in the analysis. Of these, 725 were on Saipan, 99 on Tinian, and 40 on Rota. These figures, especially on Rota, are very small, but they are justified by the fact that neither Tinian nor Rota have access to many of the purchases that people on Saipan or other islands and countries would have since the populations are so small.
The sample sizes required different weights than those for the regular questionnaires for population, housing, and annual and regular expenditures. The average weight for the CNMI was 19.3, so that all purchases were multiplied by that figure to obtain estimates for all households in the Commonwealth. The weight for Saipan was 20.5 (so about 5 percent of the units were actually enumerated), 9.4 for Tinian, and 22.7 for Rota.
The following table shows the diary items purchased in the two weeks the respondents filled the diaries. Because the enumerators provided the diaries at the time of the regular enumeration, the diaries followed the time the household was first contacted during the enumeration. Hence, the two weeks were not the same two weeks throughout the enumeration period. But, because neither Christmas nor Easter or other big holidays occurred during enumeration, the results should be comparable.
The respondents were asked to fill the diaries daily, at the end of the day, and include all purchases by all members of the household. So, small purchases, like chewing gum and individual beers at a bar on the way home were included in addition to grocery shopping for bread, milk, and eggs.
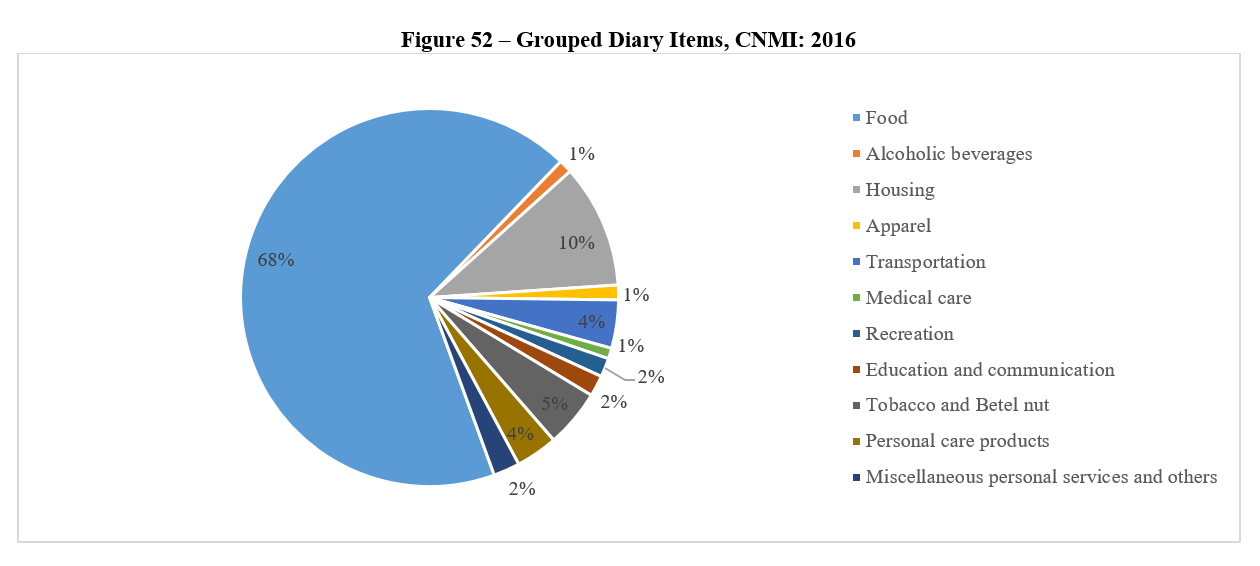
As would be expected, most of the purchases during the two weeks were food items. The chart shows the large categories and the sub-categories, which are mostly types of food. About 68 percent of all purchases were food items, and these amounted to 37 percent of the $6.7 million of purchases. The largest numbers of food purchases were for meats, poultry, fish and eggs (about 109,000 based on the weighted figures), followed by fruits and vegetables (93,000), and soup, canned chili, and canned spaghetti (90,000).
Housing was the next largest category. This category includes rents, but also utilities, furniture and small appliance purchases, and other home items. The CNMI made about 76,000 purchases using the weights, and spent about $1.2 million.
Tobacco and betel nut purchases were the next largest, with about 35,000 purchases and about $206,000. About two-thirds of the purchases were for tobacco products – cigarettes, cigars, and chew, while the other one-third was for betel nut. So, total betel nut purchases for the two weeks amounted to almost $40,000; inflated to the whole year, this figure would be about $1 million.
The graphic shows the distribution of the major diary grouped items. As noted, food purchases make up majority of the purchases.
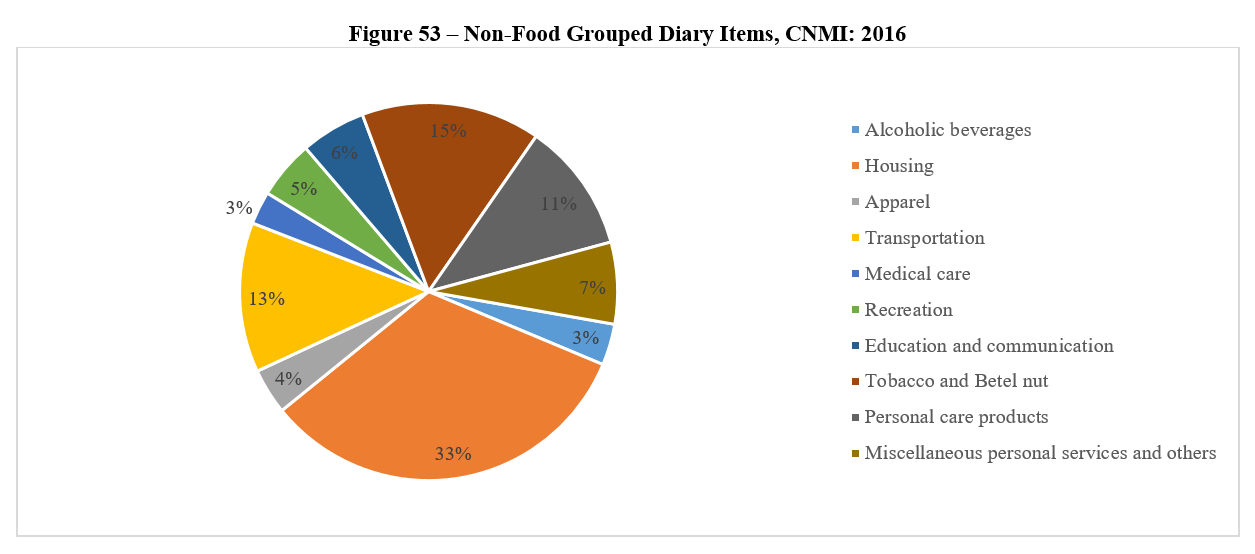
Since the food items were two-thirds of all purchases during the two-week period, the other items are somewhat obscured. When we take the food items out, we find that housing is the next largest group, with about 1 in every 3 of the non-food purchases. And, tobacco and betel nut was next, with about 15 percent of non-food purchases. Transportation was next, at 13 percent.
When we rank all the individual items in the survey, we find that purchase of cigarettes was the largest single item, with about 23,000 purchases, amounting to about $163,000 for the two weeks (or $4 million over a year for the whole CNMI.) Gasoline purchases was second, with about 20,000, but the cost was higher, of course. The two-week total, inflated to the whole Commonwealth, was about $450,000, or about $12 million for the whole year.
The table shows the top 50 individual purchases. These include expected purchases like eggs, butane gas, water, and bread. But the purchases also show different life-styles of the population, including those eating a lot of fast food and sugared drinks. Another paper will look at the relationship of education, income, and other demographic characteristics to regular and diary expenditures.
HIES 2016
HIES 2016 Table 23. Major Diary Item Groups by Island, CNMI: 2016
Household Income and Expenditures Survey 2016 CNMI CSD
Note: Diary Weights: CNMI: 19.3 Saipan: 20.5 Tinian: 9.4 Rota: 22.7
Note: Diaries were for two weeks purchases; to obtain annual estimates, multiply by 26
HIES 2016 Table 23. Major Diary Item Groups by Island, CNMI: 2016
Table Data:
| Item Group | CNMI | Saipan | Tinian | Rota |
|---|---|---|---|---|
| Cereals and Cereal Products | 33,495 | 29,611 | 1,749 | 2,310 |
| Bakery Products | 37,264 | 33,528 | 1,749 | 2,401 |
| Meats poultry fish and eggs | 108,833 | 97,322 | 5,949 | 5,640 |
| Dairy and related products | 26,517 | 22,926 | 1,525 | 2,061 |
| Fruits and vegetables | 92,695 | 76,898 | 6,697 | 7,475 |
| Carbonated and energy drinks | 31,079 | 27,663 | 1,440 | 2,378 |
| Juices and water | 22,246 | 20,322 | 935 | 1,359 |
| Beverage materials including coffee | 16,912 | 14,908 | 823 | 1,359 |
| Sugar and artificial sweetener | 3,344 | 2,789 | 281 | 159 |
| Candy and chewing gum | 9,123 | 8,510 | 337 | 476 |
| Other sweets | 2,609 | 2,317 | 75 | 317 |
| Fats and oils | 7,789 | 6,726 | 533 | 408 |
| Soups canned chili and spaghetti | 90,279 | 81,943 | 3,704 | 6,319 |
| Snacks | 18,922 | 16,446 | 889 | 1,857 |
| Spices seasonings condiments etc. | 14,186 | 12,447 | 898 | 702 |
| Baby food | 135 | 144 | – | – |
| Other miscellaneous foods | 15,018 | 12,898 | 889 | 1,200 |
| Food away from home | 37,341 | 36,029 | 776 | 2,084 |
| Beer | 6,823 | 5,721 | 327 | 883 |
| Distilled spirits and wine | 1,334 | 1,312 | 47 | – |
| Housing | 75,764 | 66,256 | 4,649 | 4,349 |
| Apparel | 9,045 | 8,961 | 168 | 294 |
| Transportation | 29,590 | 26,884 | 1,272 | 1,903 |
| Medical care | 6,513 | 5,988 | 299 | 294 |
| Recreation | 11,539 | 10,725 | 440 | 612 |
| Education and communication | 12,853 | 11,545 | 655 | 725 |
| Cigarettes items | 24,179 | 21,716 | 1,001 | 1,925 |
| Betelnut | 11,229 | 9,720 | 374 | 1,518 |
| Personal care products | 25,686 | 23,008 | 1,422 | 1,246 |
| Miscellaneous personal services and others | 16,139 | 14,088 | 720 | 1,608 |
HIES 2016 Table 24. Largest Single Item Diary Purchases by Island, CNMI: 2016
Household Income and Expenditures Survey 2016 CNMI CSD
Note: Diary Weights: CNMI: 19.3 Saipan: 20.5 Tinian: 9.4 Rota: 22.7
Note: Diaries were for two weeks purchases; to obtain annual estimates, multiply by 26
HIES 2016 Table 24. Largest Single Item Diary Purchases by Island, CNMI: 2016
Table Data:
| Item Code | CNMI | Saipan | Tinian | Rota |
|---|---|---|---|---|
| Cigarettes | 23,444 | 20,957 | 1,010 | 1,880 |
| Gasoline | 20,217 | 18,230 | 870 | 1,450 |
| Food-plates takeout | 13,549 | 13,883 | 187 | 91 |
| Eggs | 13,317 | 11,299 | 926 | 883 |
| Butane Gas | 13,162 | 11,155 | 870 | 997 |
| Water in containers of 3 gallons or more | 12,853 | 11,668 | 720 | 430 |
| Bread – Not Specified | 10,089 | 8,941 | 711 | 227 |
| Rice | 9,451 | 8,243 | 552 | 634 |
| Coke/Pepsi | 8,871 | 8,243 | 262 | 657 |
| Onions | 8,736 | 7,198 | 664 | 680 |
| Betelnut | 8,697 | 7,444 | 346 | 1,133 |
| Laundry | 7,344 | 6,398 | 365 | 657 |
| Other prepared food | 7,306 | 6,541 | 309 | 589 |
| Vegetables | 7,248 | 5,967 | 730 | 136 |
| Milk | 6,997 | 5,988 | 421 | 566 |
| Root Beer | 6,997 | 5,844 | 486 | 566 |
| Other juice | 6,997 | 6,295 | 290 | 544 |
| Beer | 6,823 | 5,721 | 327 | 883 |
| Soap | 6,301 | 5,639 | 383 | 227 |
| Instant coffee | 5,818 | 5,188 | 383 | 159 |
| Other chips | 5,818 | 5,168 | 196 | 634 |
| Banana | 5,779 | 5,024 | 337 | 408 |
| Phone Card | 5,760 | 5,168 | 355 | 181 |
| Long Bread | 5,702 | 5,086 | 206 | 566 |
| Drinking water (Bottled Water) | 5,566 | 5,209 | 168 | 362 |
| Tuna canned | 5,470 | 4,860 | 234 | 476 |
| Sausage | 5,257 | 4,634 | 243 | 453 |
| Ramen/saimin | 5,141 | 4,655 | 187 | 430 |
| Cookies | 5,064 | 4,593 | 234 | 294 |
| Vegetable oil | 4,851 | 4,265 | 327 | 181 |
| Carbonated drinks | 4,832 | 4,204 | 224 | 476 |
| Luncheon meat | 4,793 | 4,552 | 140 | 249 |
| Franks / Hot Dogs | 4,774 | 4,306 | 271 | 181 |
| Garlic | 4,774 | 3,958 | 318 | 453 |
| Assam Tea (All Flavor) | 4,716 | 4,204 | 150 | 521 |
| Shampoo | 4,697 | 4,019 | 318 | 294 |
| Lunch | 4,581 | 3,937 | 122 | 725 |
| Ice tea | 4,426 | 3,958 | 243 | 227 |
| Chicken Unspecified | 4,291 | 3,404 | 449 | 181 |
| Dish detergent | 4,252 | 3,548 | 318 | 294 |
| Detergent – Laundry | 4,233 | 3,712 | 309 | 113 |
| Spam | 4,194 | 3,630 | 253 | 294 |
| Ice cube/ice cake | 4,194 | 3,158 | 290 | 725 |
| Eggplant | 4,175 | 3,322 | 299 | 498 |
| Other locally proc. food | 3,981 | 3,178 | 355 | 294 |
| Instant Noodle | 3,943 | 3,609 | 196 | 159 |
| Other coffee | 3,866 | 3,260 | 122 | 634 |
| Corned beef | 3,846 | 3,486 | 196 | 181 |
| Sweet Bread | 3,827 | 3,773 | 112 | 45 |
| Fresh fish | 3,827 | 2,871 | 374 | 408 |
HIES 2016
HIES 2016 Table 23. Major Diary Item Groups by Island, CNMI: 2016
Household Income and Expenditures Survey 2016 CNMI CSD
Note: Diary Weights: CNMI: 19.3 Saipan: 20.5 Tinian: 9.4 Rota: 22.7
Note: Diaries were for two weeks purchases; to obtain annual estimates, multiply by 26
HIES 2016 Table 23. Major Diary Item Groups by Island, CNMI: 2016
Table Data:
| Item Group | CNMI | Saipan | Tinian | Rota |
|---|---|---|---|---|
| Cereals and Cereal Products | $305,742 | $252,739 | $18,782 | $33,635 |
| Bakery Products | $122,885 | $105,730 | $5,659 | $13,522 |
| Meats poultry fish and eggs | $726,368 | $602,513 | $56,785 | $48,222 |
| Dairy and related products | $123,252 | $104,541 | $7,530 | $10,713 |
| Fruits and vegetables | $284,289 | $210,127 | $23,767 | $43,511 |
| Carbonated and energy drinks | $80,538 | $66,789 | $4,434 | $9,875 |
| Juices and water | $69,695 | $62,503 | $3,592 | $3,941 |
| Beverage materials including coffee | $57,461 | $49,728 | $3,096 | $4,938 |
| Sugar and artificial sweetener | $8,562 | $6,726 | $861 | $521 |
| Candy and chewing gum | $24,449 | $22,557 | $1,029 | $1,246 |
| Other sweets | $7,770 | $6,070 | $365 | $1,540 |
| Fats and oils | $45,555 | $36,399 | $4,059 | $3,352 |
| Soups canned chili and spaghetti | $576,367 | $544,932 | $16,892 | $32,616 |
| Snacks | $54,774 | $44,498 | $3,292 | $7,044 |
| Spices seasonings condiments etc. | $30,499 | $24,689 | $2,376 | $2,718 |
| Baby food | $3,904 | $4,142 | $- | $- |
| Other miscellaneous foods | $47,275 | $39,474 | $2,806 | $5,006 |
| Food away from home | $453,927 | $446,154 | $8,100 | $19,547 |
| Beer | $89,912 | $69,639 | $4,181 | $18,324 |
| Distilled spirits and wine | $19,714 | $18,907 | $917 | $- |
| Housing | $1,215,625 | $1,058,366 | $68,861 | $88,856 |
| Apparel | $231,795 | $228,911 | $4,724 | $7,361 |
| Transportation | $995,137 | $915,500 | $46,019 | $43,556 |
| Medical care | $85,795 | $84,260 | $2,235 | $2,039 |
| Recreation | $215,657 | $181,952 | $13,310 | $19,524 |
| Education and communication | $310,149 | $282,617 | $14,404 | $16,421 |
| Cigarettes items | $167,087 | $142,908 | $9,064 | $16,014 |
| Betelnut | $38,829 | $31,621 | $1,758 | $6,319 |
| Personal care products | $120,295 | $107,453 | $6,791 | $5,844 |
| Miscellaneous personal services and others | $814,212 | $669,507 | $56,673 | $77,463 |
HIES 2016 Table 24. Largest Single Item Diary Purchases by Island, CNMI: 2016
Household Income and Expenditures Survey 2016 CNMI CSD
Note: Diary Weights: CNMI: 19.3 Saipan: 20.5 Tinian: 9.4 Rota: 22.7
Note: Diaries were for two weeks purchases; to obtain annual estimates, multiply by 26
HIES 2016 Table 24. Largest Single Item Diary Purchases by Island, CNMI: 2016
Table Data:
| Item Code | CNMI | Saipan | Tinian | Rota |
|---|---|---|---|---|
| Cigarettes | $163,356 | $139,073 | $9,092 | $15,832 |
| Gasoline | $455,434 | $414,348 | $19,212 | $29,558 |
| Food-plates takeout | $118,922 | $122,976 | $1,113 | $815 |
| Eggs | $47,082 | $36,788 | $3,798 | $5,345 |
| Butane Gas | $94,067 | $72,038 | $7,679 | $12,072 |
| Water in containers of 3 gallons or more | $65,559 | $59,632 | $4,209 | $770 |
| Bread – Not Specified | $28,373 | $24,546 | $2,058 | $1,178 |
| Rice | $176,422 | $139,873 | $12,983 | $20,793 |
| Coke/Pepsi | $20,990 | $18,045 | $655 | $3,080 |
| Onions | $16,139 | $11,750 | $1,637 | $1,993 |
| Betelnut | $33,823 | $27,704 | $1,721 | $4,847 |
| Laundry | $84,983 | $72,715 | $3,667 | $10,419 |
| Other prepared food | $73,039 | $71,054 | $1,983 | $2,288 |
| Vegetables | $33,069 | $25,612 | $4,153 | $408 |
| Milk | $46,831 | $40,602 | $2,432 | $4,145 |
| Root Beer | $25,841 | $20,957 | $1,787 | $2,786 |
| Other juice | $19,057 | $16,938 | $851 | $1,563 |
| Beer | $89,912 | $69,660 | $4,181 | $18,324 |
| Soap | $20,700 | $18,189 | $1,384 | $815 |
| Instant coffee | $26,363 | $22,844 | $1,852 | $1,178 |
| Other chips | $14,902 | $12,304 | $767 | $2,016 |
| Banana | $24,430 | $20,814 | $1,843 | $1,178 |
| Phone Card | $42,675 | $37,075 | $3,180 | $1,359 |
| Long Bread | $16,506 | $14,006 | $683 | $2,220 |
| Drinking water (Bottled Water) | $18,728 | $18,353 | $309 | $929 |
| Tuna canned | $23,734 | $19,768 | $1,010 | $3,556 |
| Sausage | $22,729 | $19,419 | $879 | $3,058 |
| Ramen/saimin | $23,638 | $21,429 | $645 | $2,469 |
| Cookies | $14,573 | $12,283 | $804 | $1,563 |
| Vegetable oil | $29,726 | $23,623 | $2,759 | $2,084 |
| Carbonated drinks | $10,282 | $8,367 | $580 | $1,427 |
| Luncheon meat | $20,932 | $17,943 | $1,431 | $1,268 |
| Franks / Hot Dogs | $17,549 | $15,195 | $1,216 | $861 |
| Garlic | $9,451 | $6,993 | $748 | $1,540 |
| Assam Tea (All Flavor) | $8,639 | $7,423 | $253 | $1,314 |
| Shampoo | $19,927 | $17,123 | $1,291 | $1,268 |
| Lunch | $58,273 | $53,091 | $2,198 | $4,326 |
| Ice tea | $11,828 | $10,458 | $533 | $1,042 |
| Chicken Unspecified | $43,564 | $32,892 | $5,434 | $1,563 |
| Dish detergent | $15,018 | $11,750 | $1,412 | $1,200 |
| Detergent – Laundry | $30,905 | $26,720 | $2,376 | $929 |
| Spam | $20,081 | $17,164 | $1,235 | $1,563 |
| Ice cube/ice cake | $10,205 | $7,895 | $580 | $1,835 |
| Eggplant | $7,171 | $5,557 | $599 | $838 |
| Other locally proc. food | $5,972 | $4,593 | $608 | $453 |
| Instant Noodle | $11,597 | $10,827 | $374 | $702 |
| Other coffee | $9,741 | $7,874 | $449 | $1,631 |
| Corned beef | $23,309 | $20,957 | $1,188 | $1,291 |
| Sweet Bread | $11,539 | $10,089 | $327 | $1,586 |
| Fresh fish | $45,458 | $29,713 | $4,761 | $8,924 |
HIES 2016
To download, right click on the chart and select “Save Image As”…