


HIES 2016 POPULATION
HIES 2016
POPULATION
The weighted number of residents in the Commonwealth of the Northern Mariana Islands (CNMI) based on the 2016 household survey was 53,890. Saipan had about 48,200 people, Tinian had about 3,056, and Rota had about 2,635. District 3 was Saipan’s largest district with 15,845, followed by District 1 with 15,164 people. The smaller districts were district 5 (7,966), district 2 (6,045), and District 4 (3,180).
CNMI had somewhat more males than females in 2016. The sex ratio was 106, meaning about 106 males for every 100 females. And, the median age was 33.4 years.
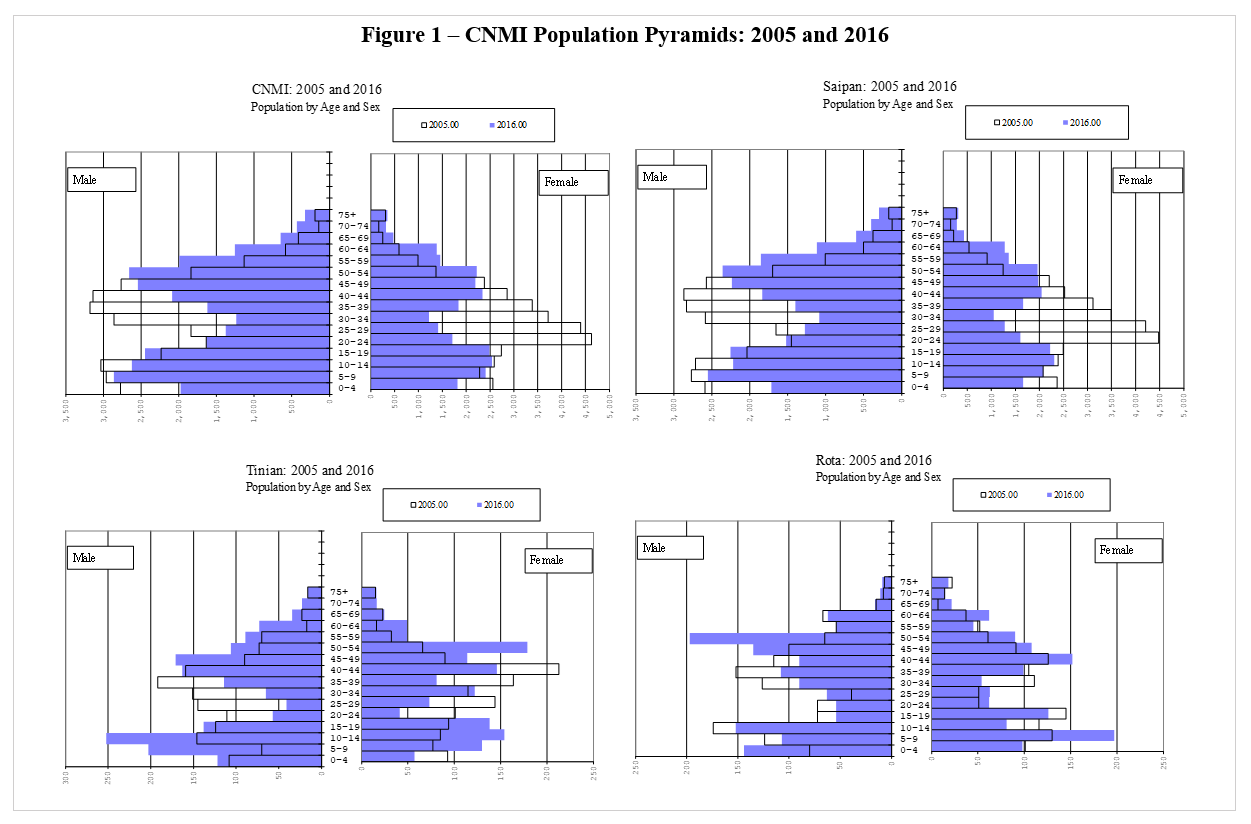
A population pyramid shows the age and sex distribution of the population. The males appear to the left of the mast; the females appear to the right. Normally, the ages appear with the youngest at the bottom, and in 5-year age groups (or sometimes single years of age) increasing, with smaller numbers at each age. The traditional pyramid, like the pyramids of Egypt, with the oldest group having the fewest members.
None of the pyramids for the CNMI or for its three islands has a traditional pyramid shape. Not in 2005 and not in 2016. Because of the large number of foreign workers, each pyramid has a large bulge in the age groups from about age 20 to 50. The pyramids show numbers of people, so the 2005 distribution is wider because it has more people total, and in most of the age groups. The 2005 pyramids are open with no color; the 2016 pyramids are colored.
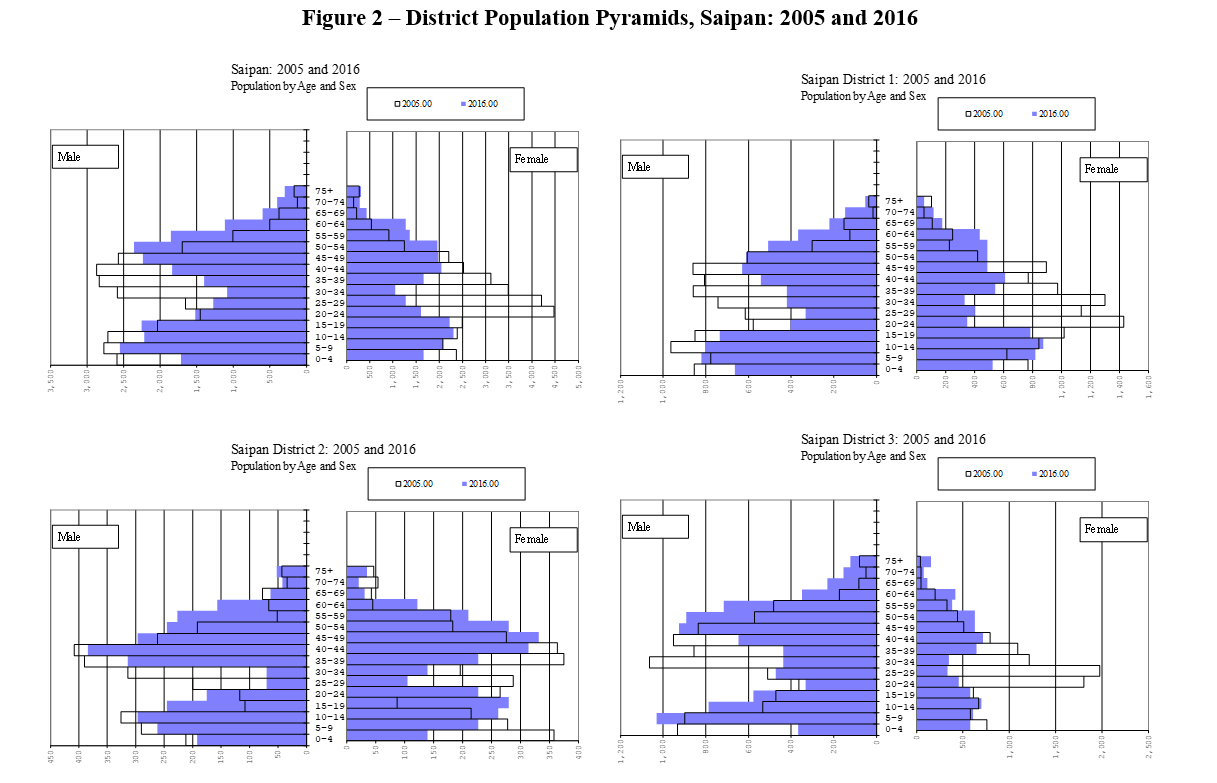
The Saipan District Pyramids are even more ragged because of the small numbers. Nonetheless, these, too, do not have the traditional shapes of pyramids because of the small numbers of children compared to the working age adults. So, each district has a shape in both 2005 and 2016 which is like that of Saipan. In many countries, the age groups would move through the pyramid upwards over time, keeping their relative shape. But the CNMI is not typical. Economic development will determine the shape of the pyramids in future years.
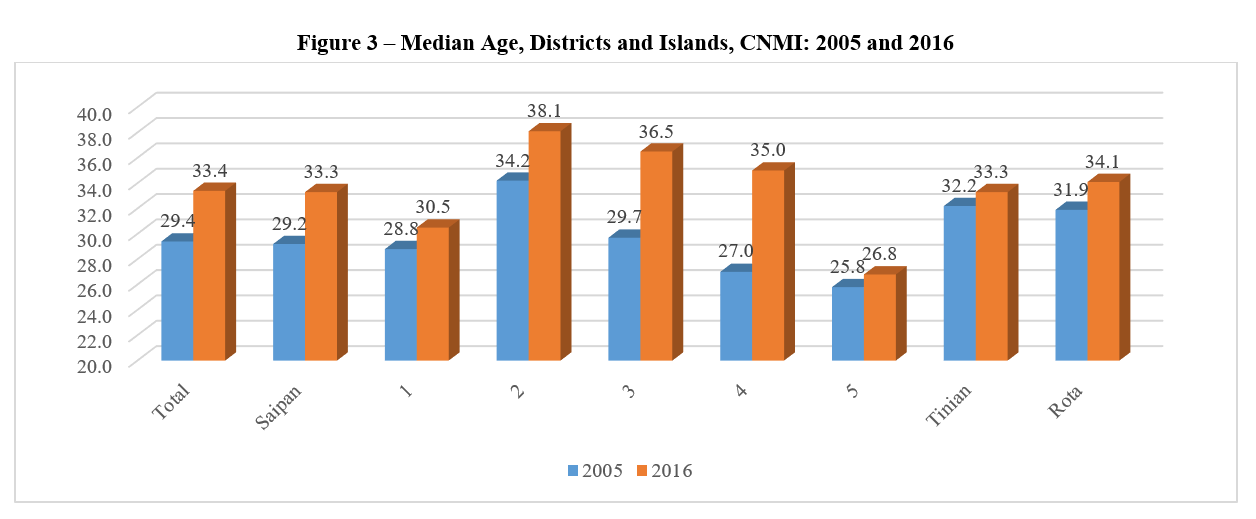
The Median Age of a population is the age that divides the population exactly in half – that is half are older and half are younger. The median age of the CNMI population in 2005 was 29.4 years, which is moderately high for Pacific Islands’ population, but CNMI has a very low birth rate, and the population dynamics are mostly affected by migration. The median increased to 33.4, an increase of 4 years over the 11 years. This rate is obviously higher, and shows an aging population, with few babies being born in the Commonwealth, and continued high numbers of foreign workers. The median was highest in District 2, at 38 years, and lowest in District 5, at 27 years. The median in Tinian was the same as for the whole population, and in Rota was slightly higher, at 34 years old.
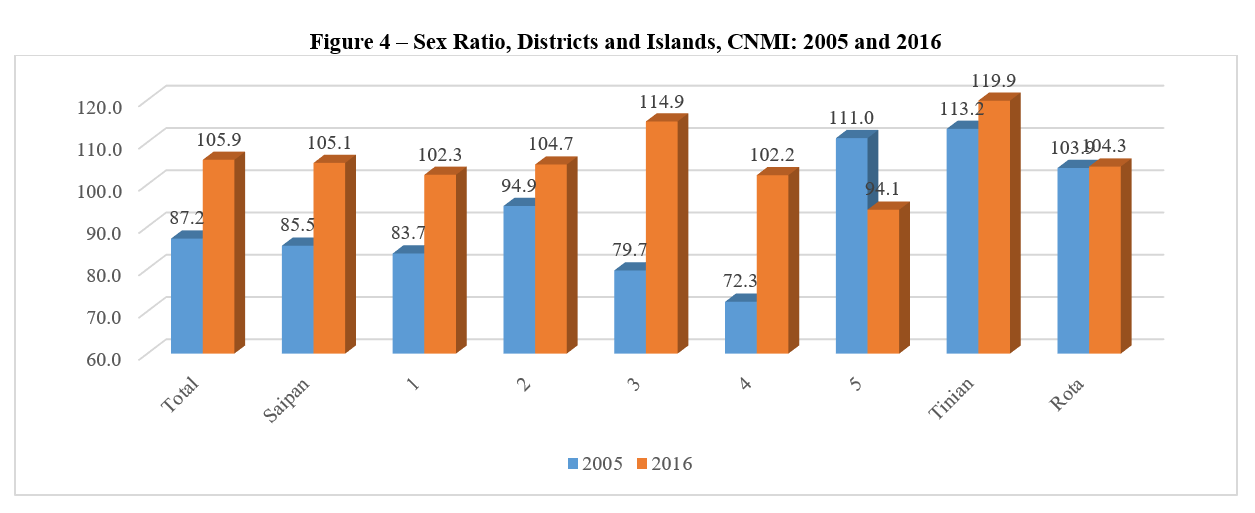
The sex ratio in the CNMI switched between 2005 and 2016, from more female (because of the garment factories while declining) to more male in 2016 (because of increased construction of the new casino and other activities.) The sex ratio (males per 100 females) increased from 87 (that is, 87 males for every 100 females) in 2005 to 106 males per 100 females in 2016. The median remained the same in Rota, at about 103, but increased in Tinian, from 113 to 120. So, on Tinian, there were 6 males for every 5 females, which could be a good ratio for the males. The sex ratio changed most dramatically in District 4 where it increased from 72 to 102, and district 3, where the increase was from 80 to 115, both of which saw garment factories in previous times. On the other hand, the ratio decreased in District 5, from 111 to 94 during the 11 years.
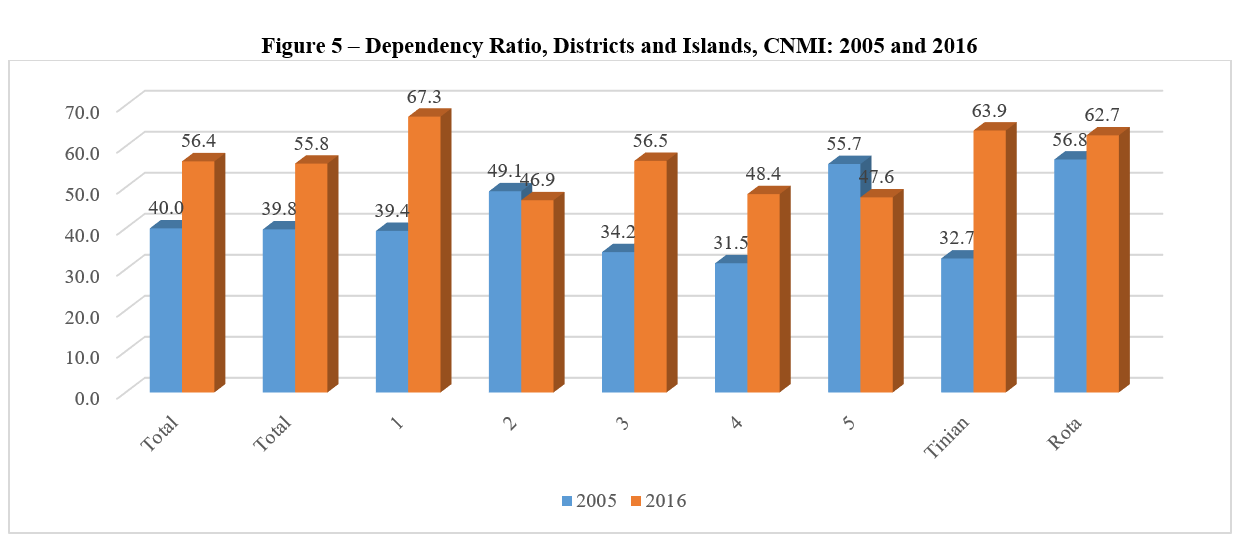
The Dependency Ratio shows the relation between young people (those under 15 years old) and age (those 60 and over) compared to potential workers (those 15 to 59). A dependency ratio of 100 would mean equal numbers of dependents and potential workers. The dependency ratios for the CNMI are generally low because the Commonwealth has relatively few children and older people compared to the numbers of potential workers – previously these were garment workers, now they are construction and tourism workers. The ratio increased from 40 in 2005 to 57 in 2016. The ratio was higher on Tinian (64) and Rota (63) than it was on Saipan (56) in 2016. The ratio was highest in District 1, at 67, which is still relatively low by world standards.
The percentage born in the CNMI increased from 43 percent in 2005 to 55 percent in 2016, mostly because of the departure of about 10,000 people in the interim, with most of them being foreign born. The percentage of CNMI born increased the most in District 5, going from 61 percent in 2005 to 74 percent in 2016; that is, almost 3 out of every 4 individuals living in District 5 in 2016 were born in the CNMI. This compares to about 1 in 3 of those living in District 2 in 2016. About 63 percent of those living on Rota in 2016 were born in the CNMI as were about 54 percent of those living on Tinian. ALL these values are very low, far lower U.S. foreign born population of 13 percent (so 87 percent native born).
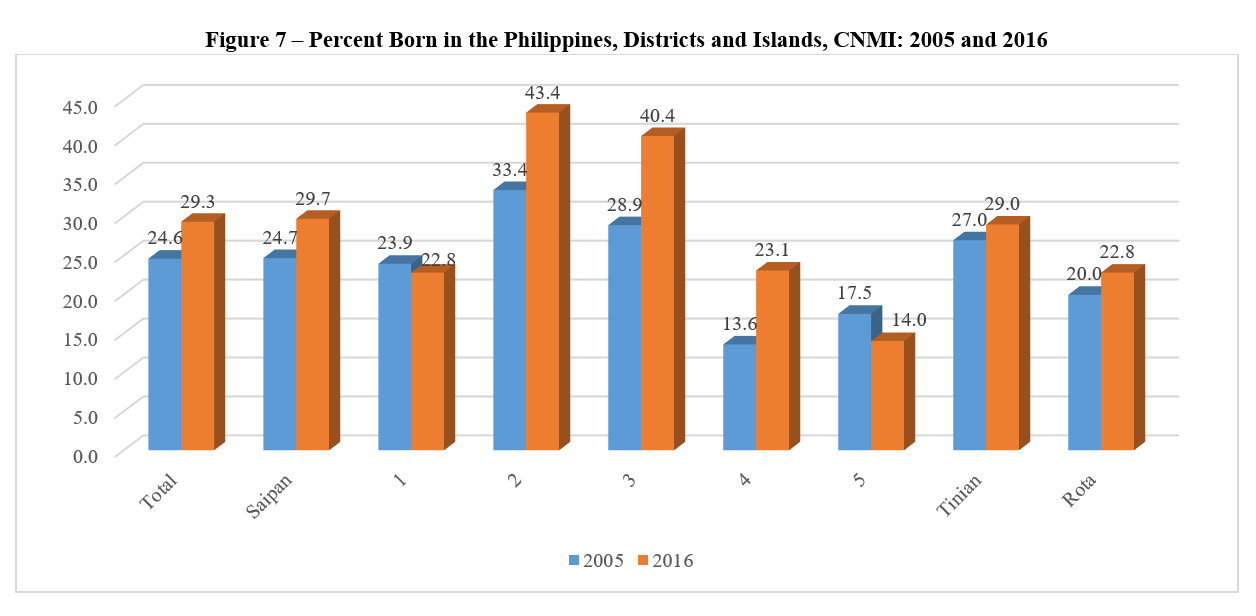
Most of the foreign born were born in the Philippines in both surveys. About 1 in 4 of the CNMI population was born in the Philippines in 2005, and that increased to about 3 in 10 in 2016. District 2 had the largest percentage of Philippines’ born in 2016, at 42 percent, 10 percentage points more than in 2005. District 3 was second, at 40 percent. About 29 percent of the Tinian population was born in the Philippines as was 23 percent of Rota’s population. These percentages are high, and seem to be increasing, perhaps changing the cultural make-up over time.
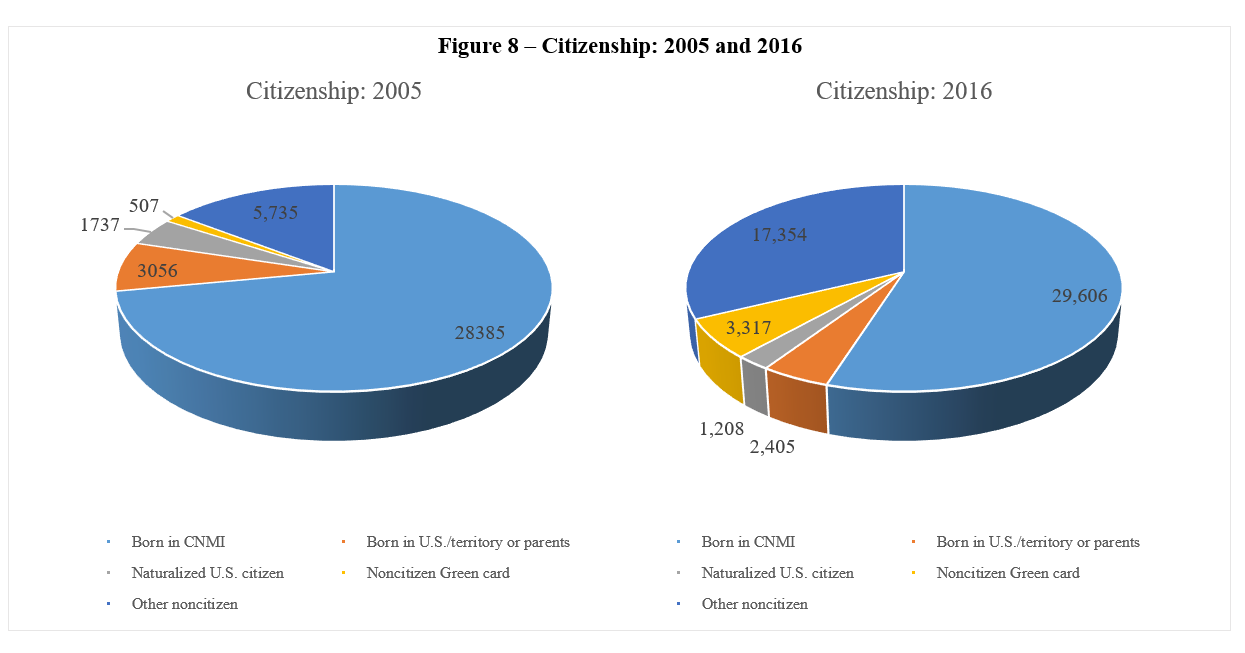
The pie charts show citizenship of the CNMI population in 2005 and 2016. The percentage of the population born in the CNMI decreased during the period while the “other citizen” population increased considerably.
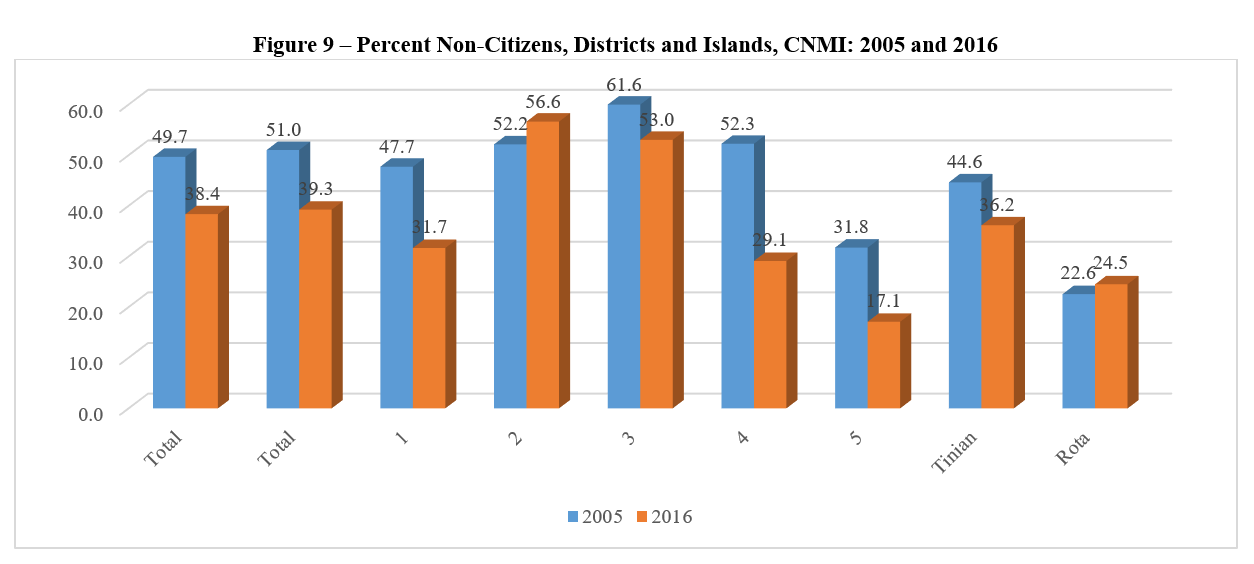
In 2005, about half of all CNMI residents were non-citizens. The percentage of non-citizens decreased to less than 40 percent in 2016, mostly because the remaining garment workers and others connected with that industry left the Commonwealth. The largest percentage of non-citizens within a District in 2005 was the 62 percent in District 3, but in 2016, District 2 had the highest percentage at 57 percent. District 2 and Rota were the only areas that saw increased between 2005 and 2016; that is, the percentage of citizens within those districts decreased. Saipan total showed the same percent as all CNMI, while about 35 percent of Tinian’s population were non-citizens as were about 1 in 4 of those on Rota.
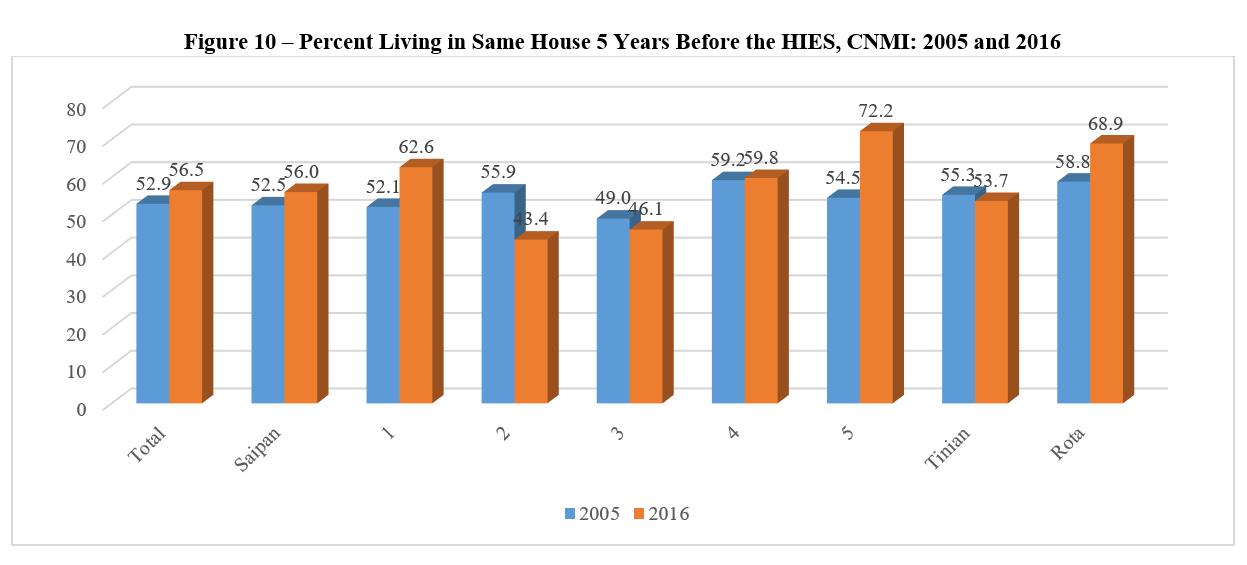
Both household surveys asked about residence 5 years before the survey. For the 2005, the year 2000 was the reference, and for 2016, 2011 was the reference. The Commonwealth saw an increase of 4 percentage points for those living in the same house 5 years before as at the time of the survey, to 56 percent in 2016. In 2016, District 5 had the largest percentage of non-movers, up almost 20 points from the 2005 enumeration. Rota was second at 69 percent living in the same house in 2011 as 2016, followed by District 1 at 63 percent. The half that about half of the population moved during the 5 years before each enumeration shows the large numbers of non-citizens coming and going for work in the CNMI.
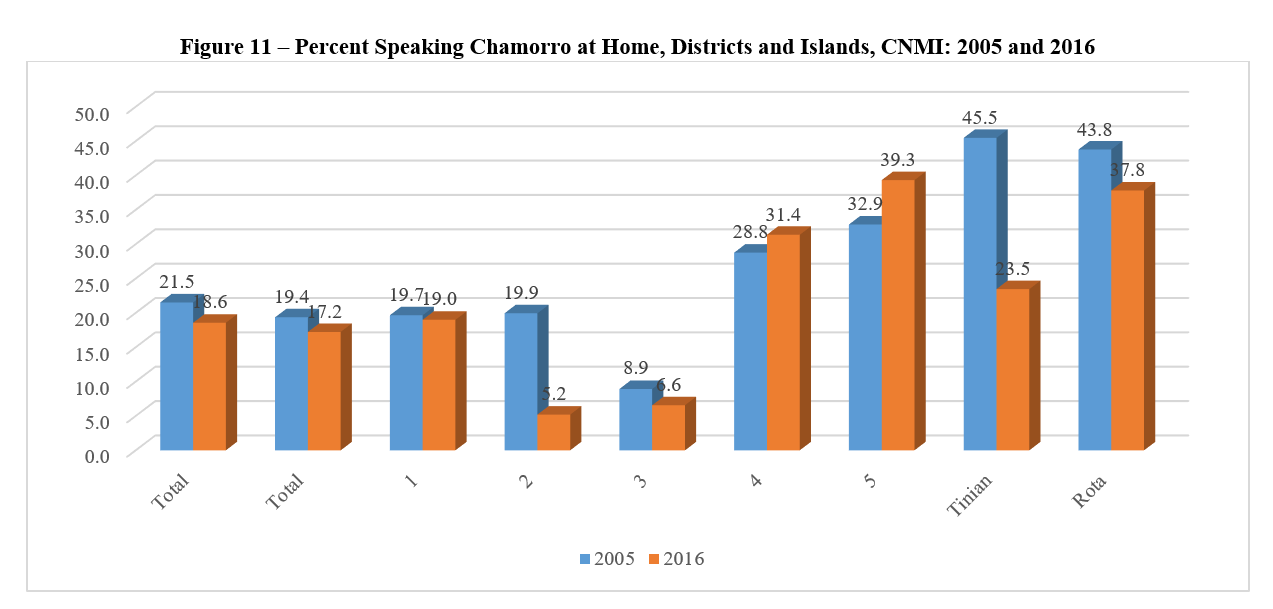
About 1 in 5 CNMI residents in both 2005 and 2016 spoke Chamorro at home. However, the percentage speaking Chamorro decreased during the 11-year period. Resident on Tinian and Rota were by far the most likely to speak Chamorro in 2005, more than 4 in 10, but, while the percentage did not decrease too much during the period on Rota, Tinian residents in 2016 were much less likely to speak Chamorro than they were in 2005. In 2016, very small percentages of residents in Districts 2 and 3 spoke Chamorro at home.
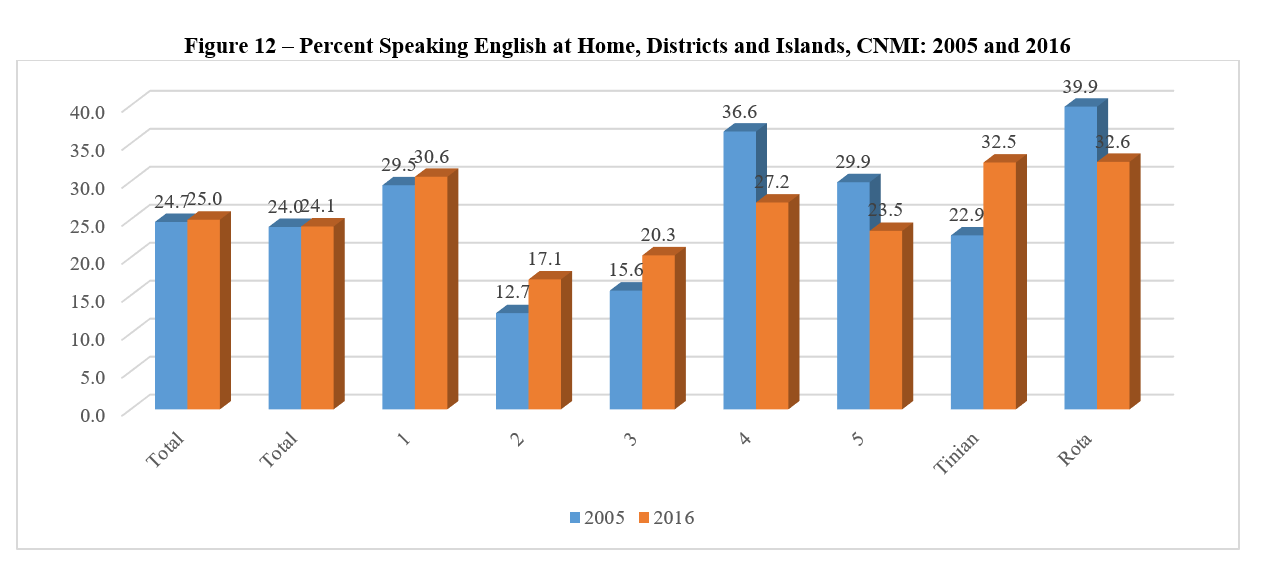
About 1 in every 4 CNMI residents in both 2005 and 2016 spoke English at home. The proportions for all of Saipan were about the same. However, while about 1 in every 6 residents in District 2 spoke English at home, that ratio was about 2 in 10 in District 3, and as much as 3 in 10 in District 1. About 1 in every 3 Tinian and Rota residents spoke English at home in 2016.
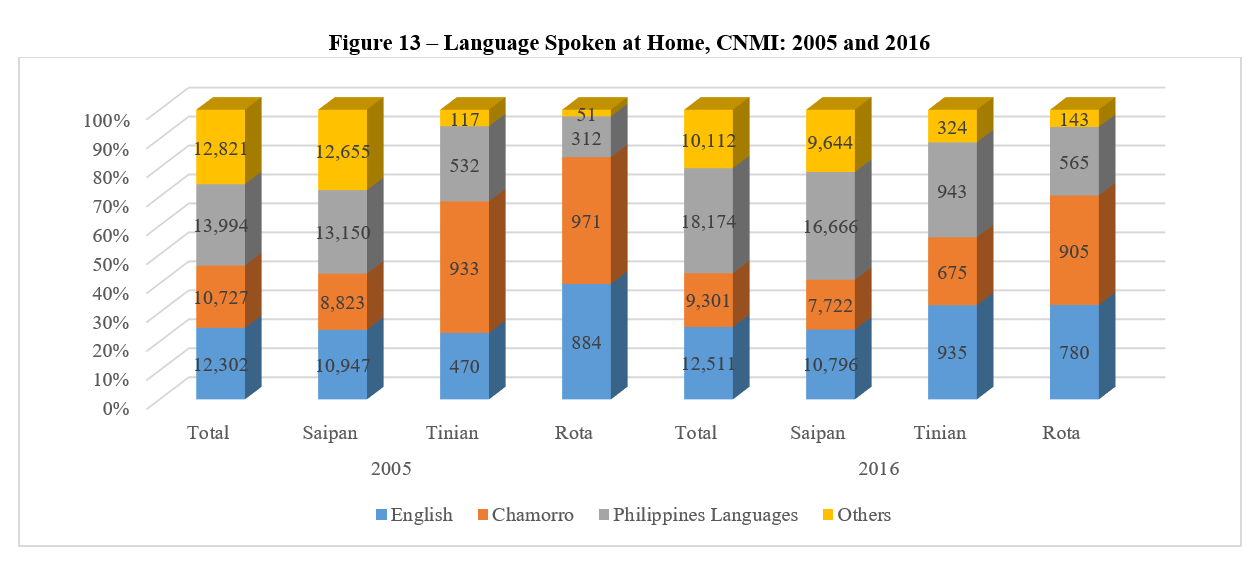
In 2005, Rota’s population was the most likely to speak English, although the proportion decreased by 2016. The percentage of Chamorro speakers decreased in both Tinian and Rota between 2005 and 2016, while the percentage of Chamorro speakers in Saipan remained at about 20 percent in both surveys. The percentages of Philippines languages’ speakers increased on all three islands during the 11-year period. And, the percentage of “other” speakers decreased on Saipan and Rota, but increased in Tinian, perhaps because of the casino’s bringing outsiders to work, not all of whom left by 2016. The decreases for the others islands were probably due to the stragglers at the end of the garment industry.
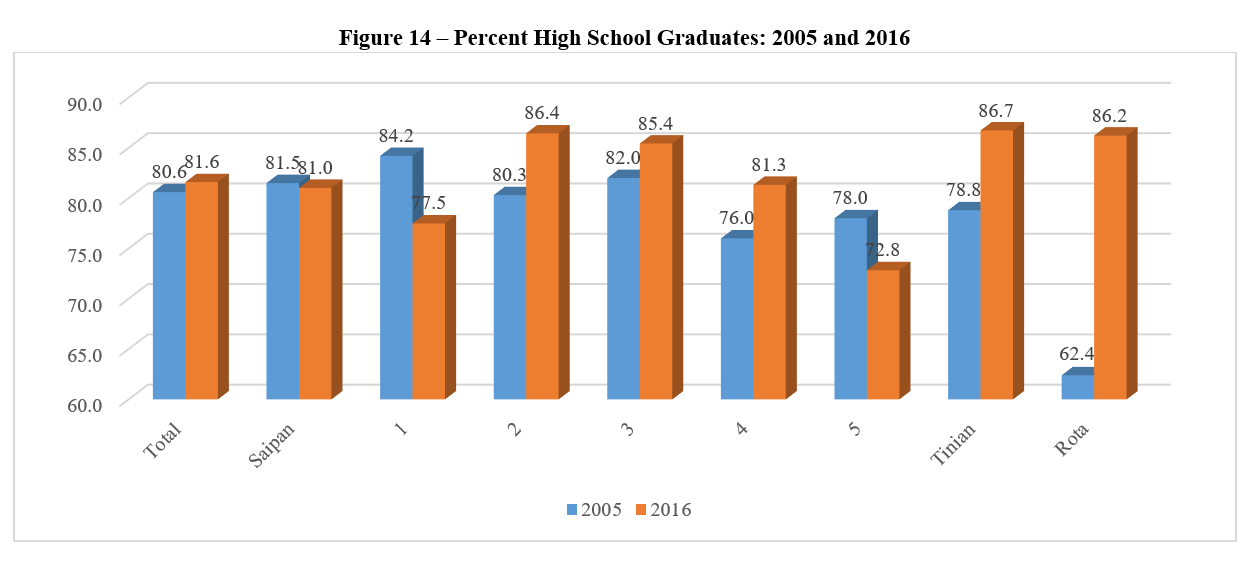
About 4 in every 5 of the CNMI residents 25 years and over in both 2005 and 2016 were high school graduates. The percentages increased most dramatically during the period in Tinian (where the increase was from about 79 percent to 87 percent), and even more in Rota (62 percent to 86 percent). On Saipan, Districts 2,3, and 4 saw increases in the percentages of high school graduates, while Districts 1 and 5 saw decreases. Still, about 3 in every 4 adults in each of the Districts had high school diplomas. Educational attainment clearly relates to jobs, so the more education, the more likely to get a good job.
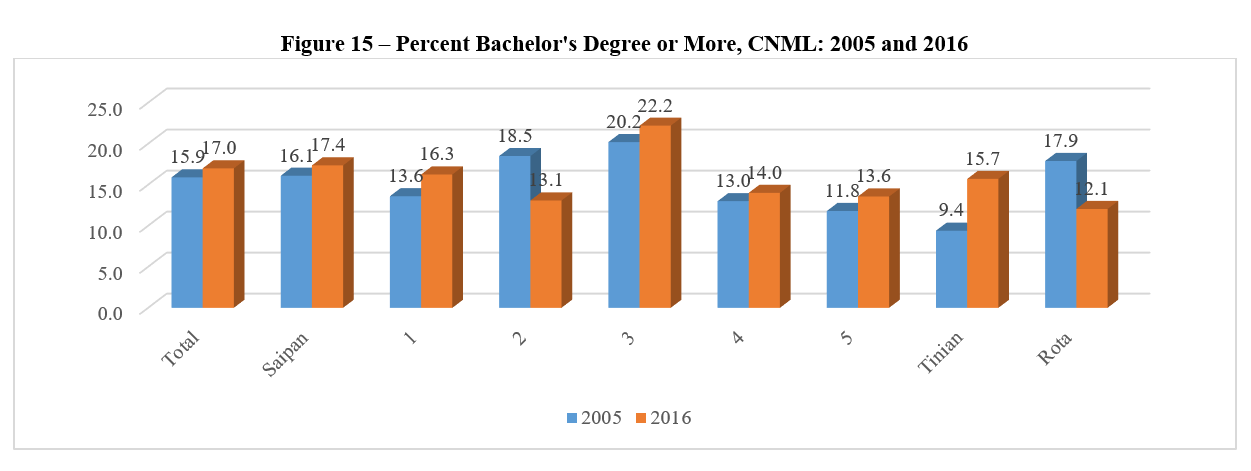
The percentage with Bachelor’s degrees or more increased only slightly during the 11-year period. District 3 had the highest percentage with college degrees, increasing from about 20 percent to 22 percent during the period. District 1 followed at about 15 percent. The other three Saipan districts saw between 13 and 14 percent college graduates in 2016, low in terms of potential employees in the public and private sectors. The percentage being college graduates increased from about 9 percent to 16 percent on Tinian between 2005 and 2016, but the percentage decreased somewhat dramatically on Rota, from about 18 percent in 2005 to about 12 percent in 2016. But Tinian and Rota have few jobs requiring college educations.
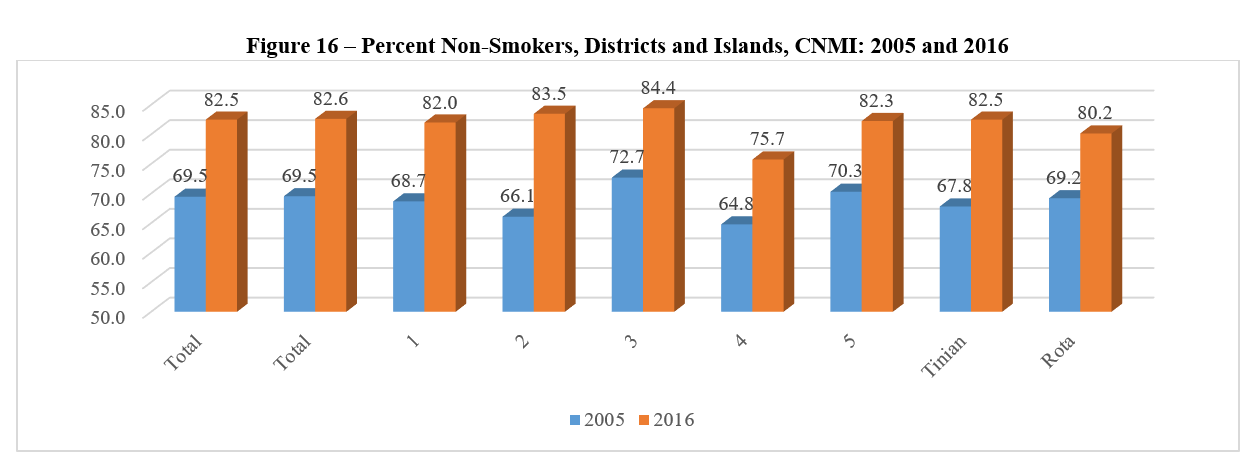
Both the 2005 and 2016 asked a few indirect questions on health, in addition to expenditures on health items. Particularly, questions that appeared on tobacco and betel nut use. The percentage of non-smokers (of tobacco) increased from about 7 in 10 in 2005 to more than 8 in 10 in 2016. The percentage of non-smokers increased on all islands and in all districts of Saipan. District 3 had the highest percentage of non-smokers, at 84 percent, while district 4 had the lowest percentage (so about 1 in 4 of the adults in District 4 were smokers – that is had at least one cigarette in the last month.) The percentage changes were about the same for all three islands.
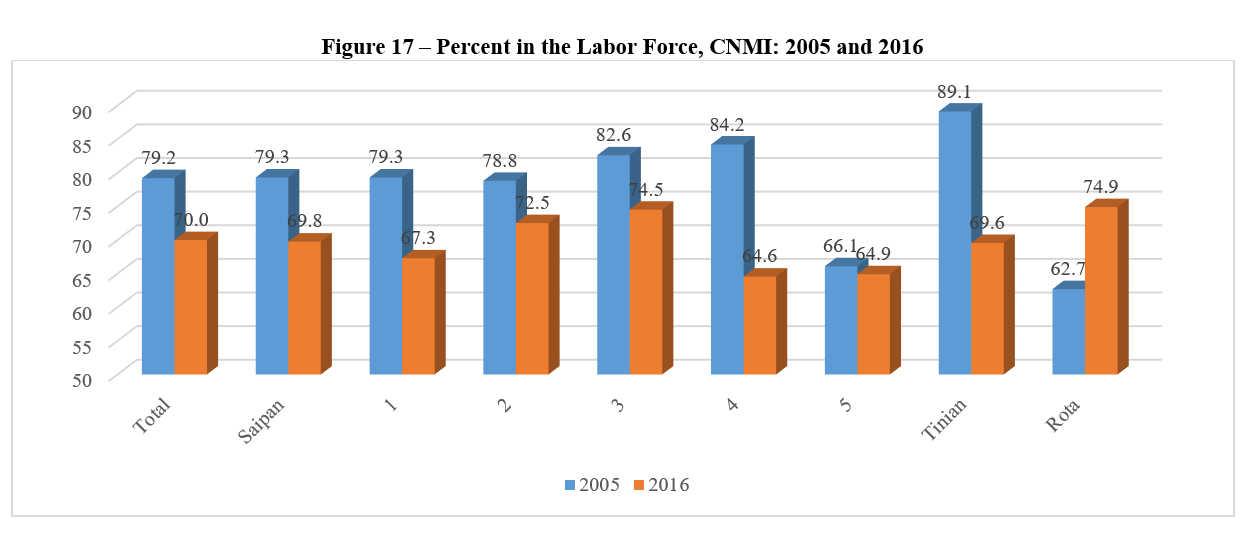
The CNMI uses the U.S. Census Bureau conventions for employment and unemployment. For a person to be in the labor force, a person must be 16 years and over and either in paid employment, temporarily on leave from paid employment, or unemployed but looking for work (including first time employees). This definition excludes those doing only subsistence activities. Many Pacific Islands countries have large parts of their populations doing subsistence only, which affects the employment and unemployment rates using the United Nations definition of labor force participation, but very few people in CNMI do subsistence activities only, so the rates would be comparable to those for Guam and the U.S. but not with other Pacific Islands’ countries.
By the U.S. definition, about 4 in 5 adults were in the labor force in 2005 but that percentage decreased to about 7 in 10 in 2016, partly because of the end of the garment industries, but before the rise in tourism (which so far has not offset the decline in the former.) Only Rota saw an increase in labor force participation, from about 63 percent to 75 percent during the period. All the other Districts and Tinian saw decreases. Tinian’s decrease was steepest, from about 9 in 10 adults all the way down to 7 in 10 in 2016. District 4’s decrease was from 84 percent to 65 percent, the sharpest of the Saipan districts.
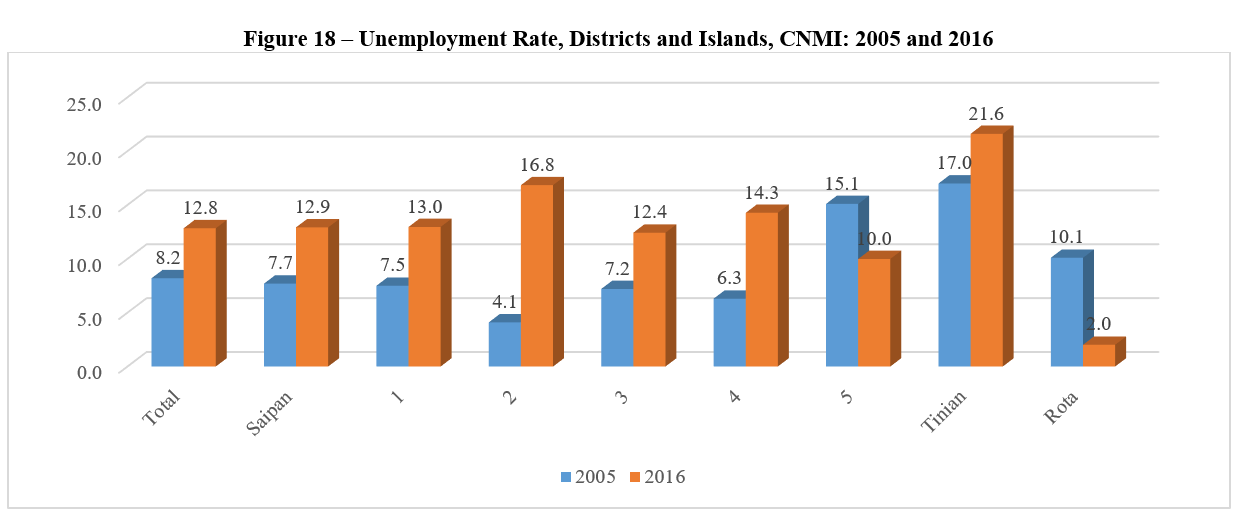
As noted above, unemployment varies a lot over time, depending on “seasonality” and other economic factors. The closing of the garment factories negatively affected employment and unemployment, but increasing tourism positively affected labor force participation, and so would normally expect to decrease unemployment. Again, the unemployment rate reflects the U.S. Census Bureau definition. The unemployment rate by this definition, that is “in the labor force” and not working, but looking for a job, increased from about 8 percent in 2005 to 13 percent in 2016. All the Districts and Tinian saw increases in the unemployment rate, while Rota’s unemployment rate decreased from 10 percent to 2 percent (although, of necessity, the sample size on Rota was very small, and so the sampling error would be very large. Similarly, again because of small numbers, but also because of economic reality on Tinian, its unemployment rate increased from 17 percent in 2005 to 22 percent in 2016. The increase on Saipan was largest in District 1, which saw an increase from just 4 percent in 2005 to 17 percent in 2016.
The occupation categories changed between 2005 and 2016. A separate publication will look at the changes in occupation between 2005 and 2016. The data for 2016 show service occupations as the largest category for the islands and districts. Office and administrative support was another large category.
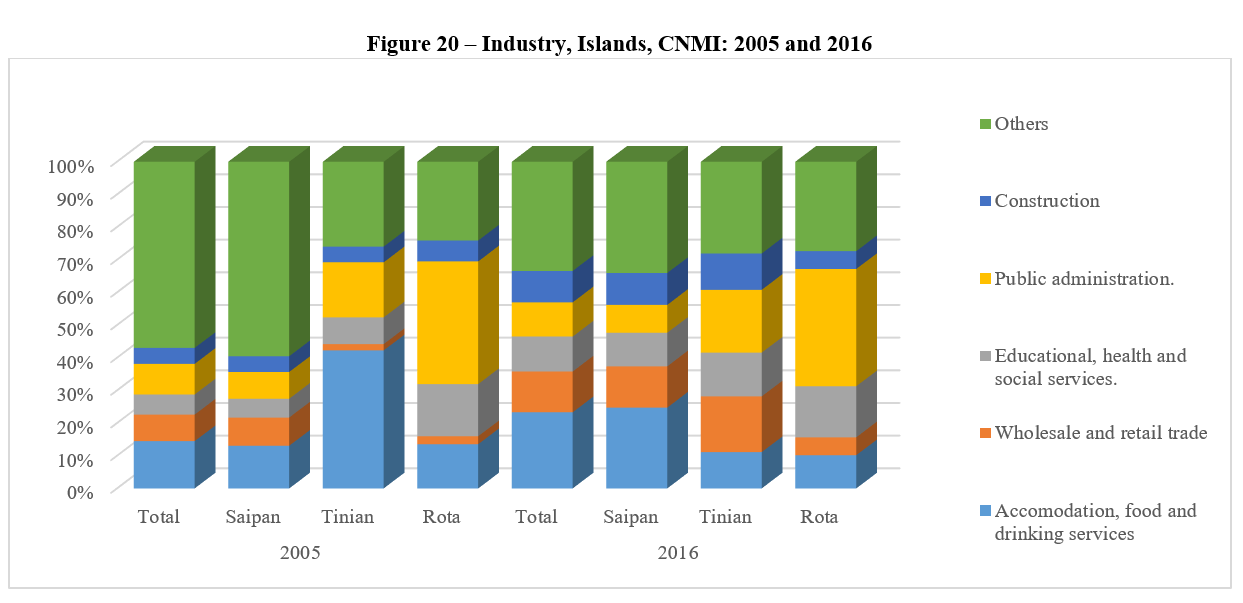
Unlike the occupation categories, which changed considerably between 2005 and 2016, the industry categories remained basically the same. Because the garment factories were still in operation in 2005, they were the biggest industry by far, with over 10,000 employees. However, as the graphic shows, the number and percent in manufacturing decreased precipitously during the 11 years. Tourism increased during the period, as did wholesale and retail trade, which are reflected in the totals and Saipan. Public administration was a large category for Tinian and Rota in both enumerations.
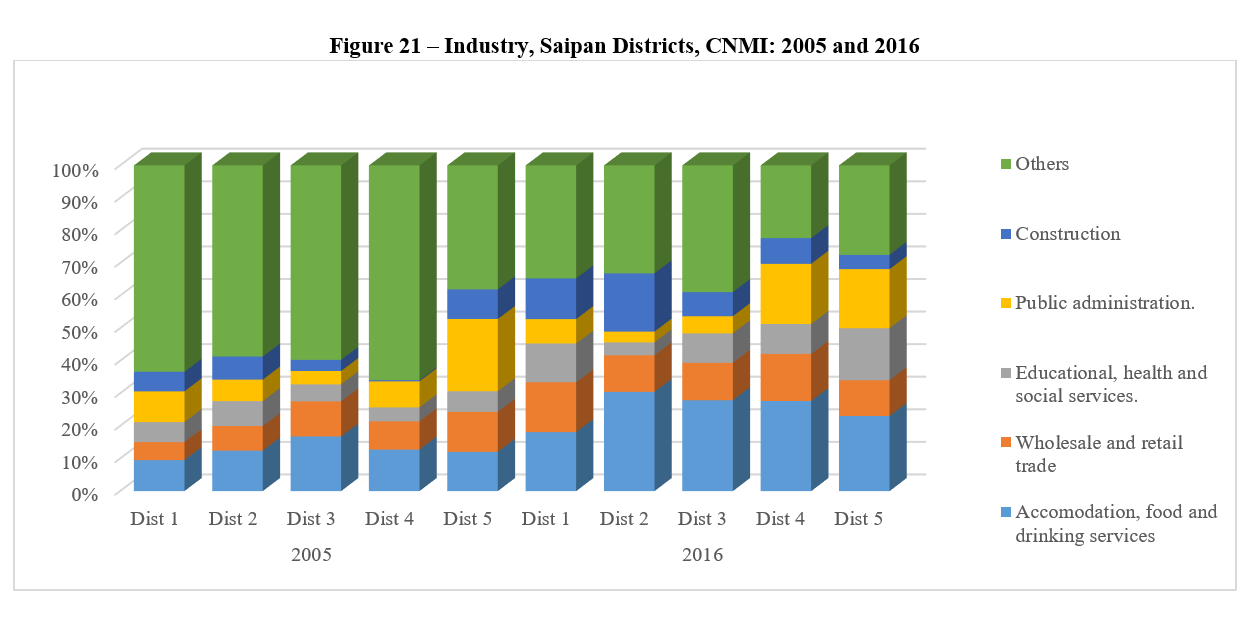
All the Saipan districts, except for District 5, saw more than half of the labor force in manufacture (and “other” industries. By 2016, these values had decreased considerably. In 2016, all districts showed effects of increased tourism in the accommodation and food category.
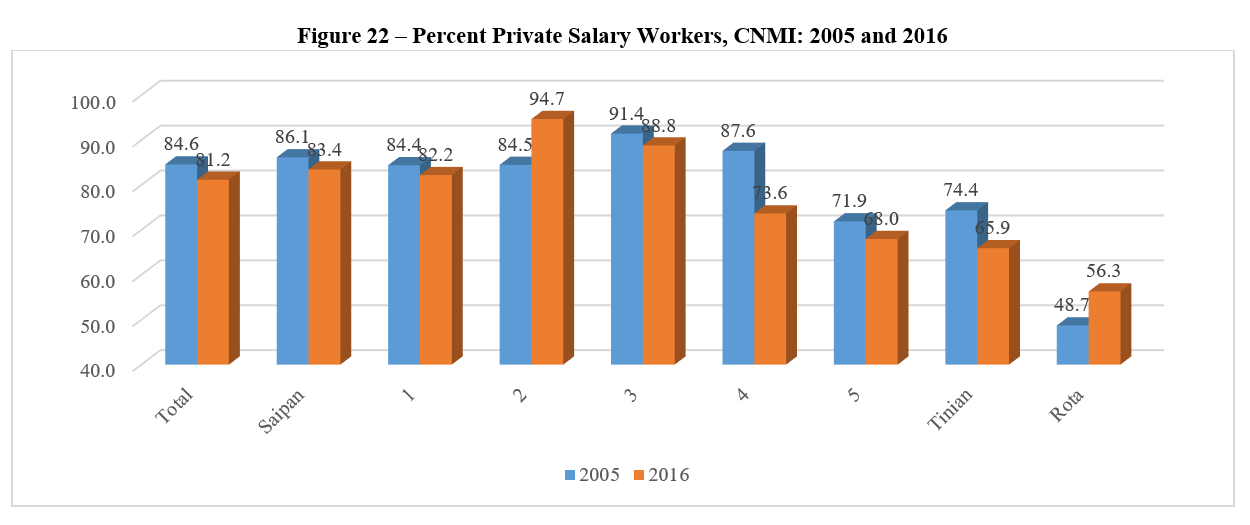
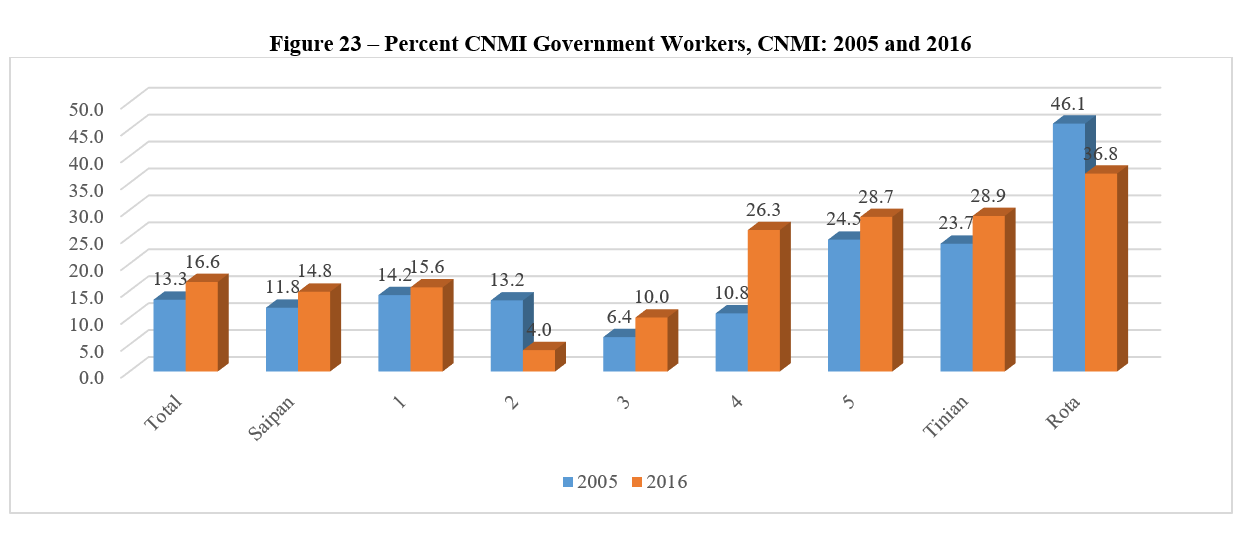
For a government to function properly, the ratio of private to public sector workers should be high. While CNMI has relatively large numbers of public sector workers relative to the private sector, it is doing better than most of the other Pacific Islands countries and has the potential for relative self-sufficiency. The percentage of private sector salary workers (so excluding self-employed workers) decreased from about 85 percent in 2005 to about 81 percent in 2016. The decrease was sharpest on Tinian of the three islands, from 74 percent to 66 percent, but Rota saw an increase from about 49 percent to 56 percent. On Saipan, the percentage of private sector workers increased well in District 2 from 84 percent to 95 percent, while the other Districts all showed decreases. The drop was strongest in District 4, from 88 percent in 2005 to only 74 percent in 2016.
On the other hand, the percentage of CNMI government workers increase from 13 percent in 2005 to 17 percent in 2016. Only District 2 in Saipan (which went from 13 percent to 4 percent) and Rota (from 46 percent to 36 percent) saw decreases. The percentage being government workers increased in Tinian from 24 to 29 percent and on Saipan from 12 to 15 percent between 2005 and 2016. As noted before, these are snapshots of the population at the time of enumeration, and could be different in months before or after the enumeration, so should be used with other data, from labor force surveys and labor registration in assessing the relationship between government and private sector employment.
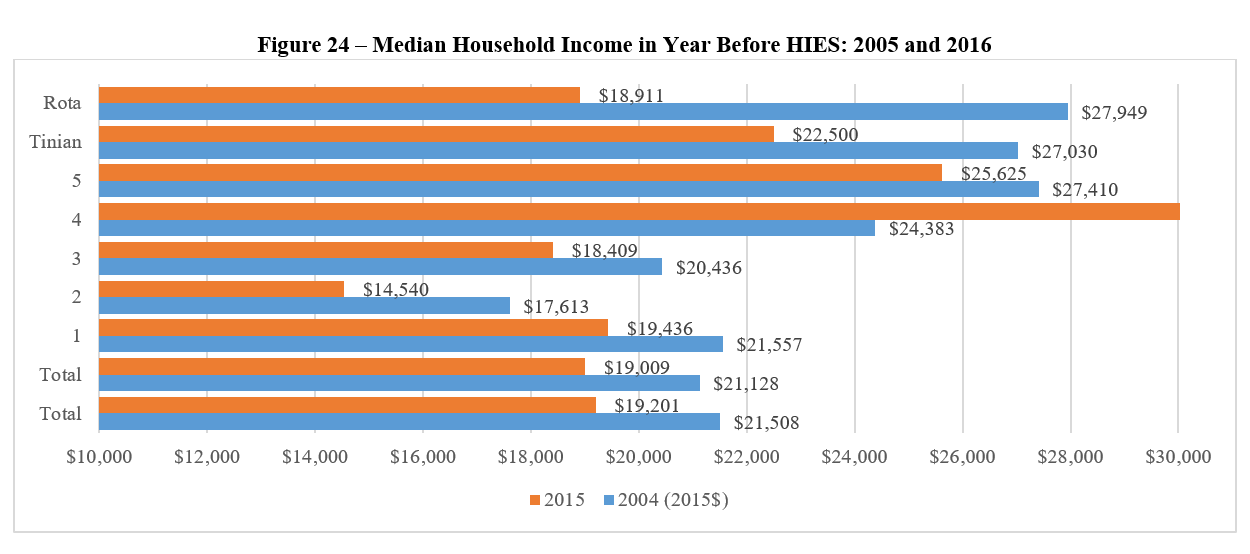
The median household income, adjusted for inflation, decreased between 2005 and 2016. Median income is the usual measure, rather than mean or average income to account for outliers. Although CNMI uses the data collected from the HIES to determine a new market basket and then the Consumer Price Index to determine changes in buying power and inflation, usually income measures apply the U.S. standard inflation factors when assessing changes in incomes across time. That value was 1.255 for the period 2004 to 2015, measuring income in the year before the census. By this measure, the median household income in the CNMI decreased from just over $20,000 in 2004 to somewhat less than $20,000 in 2016. All the Saipan Districts except District 4 saw decreases over the period, but District 4 increased from a household median income of about $24,000 to almost $30,000. Tinian’s median household income decreased by about one-third during the period, while Rota’s decreased by about half.
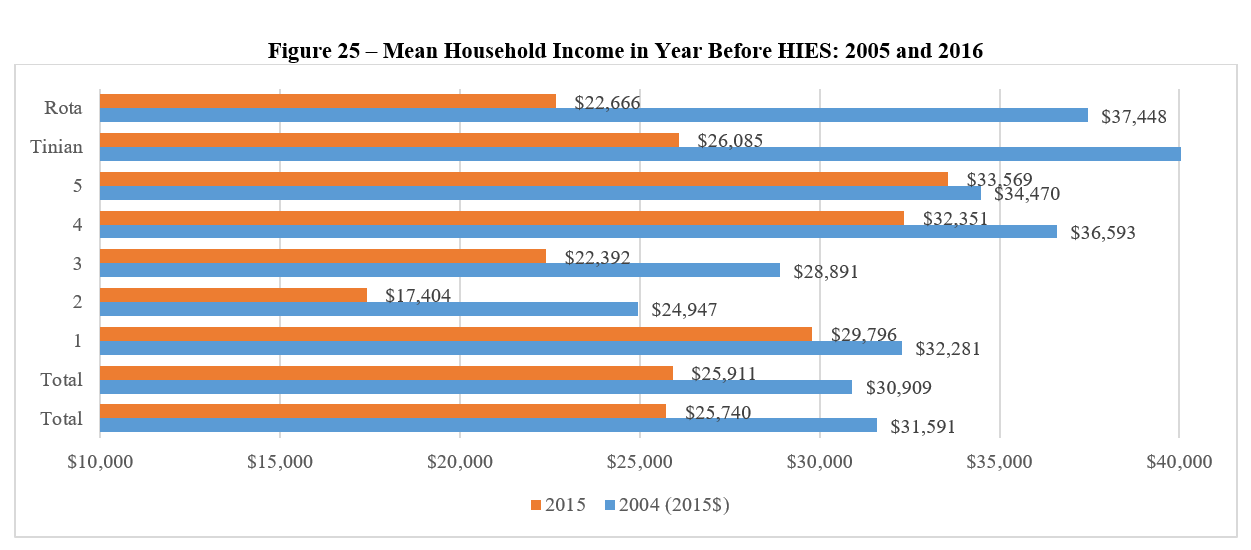
The mean household income does include outliers, so those households making significantly more income will push the average up. By this measure, again with inflation applied to the 2004 values, the mean household for the CNMI decreased from about $30,000 in 2005 to about $25,000 in 2016. All the Saipan Districts saw decreases as did both Tinian and Rota, which decreased by half, assuming the inflation factor used for the States applies for the CNMI.
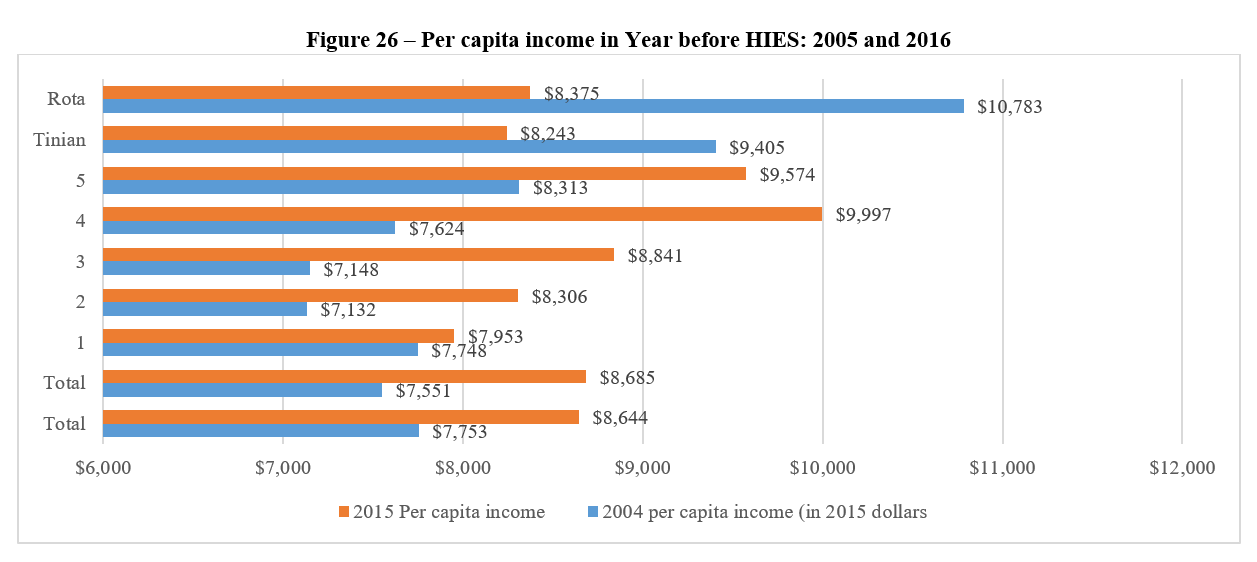
Per capita income is obtained by dividing all the income earned by all paid workers by everyone living on the islands at the time. For our purposes, we applied the U.S. inflation to the 2005 total earned income. Here, the results are “better”. The per capita income increased from less than $8,000 in 2004 to more than $8,000 in 2016. All the Districts on Saipan saw increases in per capita income during the 11 years. However, both Tinian and Rota saw decreases, with Rota seeing a decrease of about $2,000 a year per person.
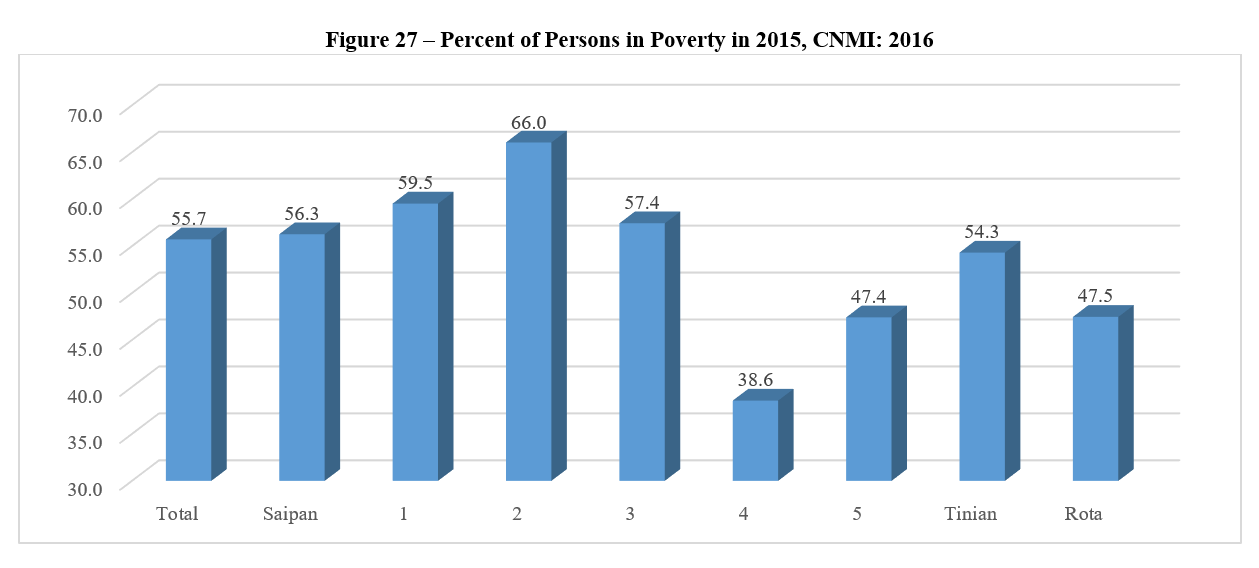
About 56 percent of CNMI’s population was living in poverty in 2015 by the U.S. Census Bureau’s definition. This rate is higher than it would be in access to traditional lands and housing were monetized, and if the CNMI had and could maintain a work force at the U.S. minimum wage. But, the values are very high, and require various Federal Programs like Snap and WIC to offset the low wages and other incomes in the Commonwealth. The percentage in poverty was highest in District 2, where 2 of every 3 people were below the poverty threshold compared to less than 2 in 5 in District 4. About 54 percent of those in Tinian were in poverty compared to about 48 percent (so less than half) of Rota’s population.
HIES 2016
HIES 2016 Table 1. Selected Population Characteristics by District and Island, CNMI: 2016
Household Income and Expenditures Survey 2016 CNMI CSD
Note: Sorting not available due to the table concept
HIES 2016 Table 1. Selected Population Characteristics by District and Island, CNMI: 2016
Table Data:
| Characteristic | CNMI | Saipan Total | Saipan District 1 | Saipan District 2 | Saipan District 3 | Saipan District 4 | Saipan District 5 | Tinian District 6 | Rota District 7 |
|---|---|---|---|---|---|---|---|---|---|
| Males | 27,713 | 24,703 | 7,669 | 3,092 | 8,473 | 1,607 | 3,861 | 1,666 | 1,345 |
| Females | 26,177 | 23,497 | 7,495 | 2,952 | 7,372 | 1,572 | 4,105 | 1,390 | 1,290 |
| Sex ratio | 105.9 | 105.1 | 102.3 | 104.7 | 114.9 | 102.2 | 94.1 | 119.9 | 104.3 |
| Median Age | 33.4 | 33.3 | 30.5 | 38.1 | 36.5 | 35.0 | 26.8 | 33.3 | 34.1 |
| Median Household Income | $19,201 | $19,009 | $19,436 | $14,540 | $18,409 | $30,769 | $25,625 | $22,500 | $18,911 |
HIES 2016 Table 1.Percentages of Characteristics by District and Island, CNMI: 2016
Household Income and Expenditures Survey 2016 CNMI CSD
HIES 2016 Table 1.Percentages of Characteristics by District and Island, CNMI: 2016
Table Data:
| Characteristic | CNMI | Saipan Total | Saipan District 1 | Saipan District 2 | Saipan District 3 | Saipan District 4 | Saipan District 5 | Tinian District 6 | Rota District 7 |
|---|---|---|---|---|---|---|---|---|---|
| Chamorro ethnicity | 26.8% | 24.6% | 30.9% | 8.4% | 9.0% | 46.1% | 47.6% | 36.7% | 54.4% |
| Filipino ethnicity | 44.9% | 45.2% | 36.3% | 65.3% | 61.2% | 29.1% | 21.5% | 47.1% | 36.1% |
| Born in CNMI | 54.6% | 54.2% | 61.2% | 38.7% | 41.8% | 63.2% | 73.7% | 54.5% | 62.6% |
| Born in the Philippines | 29.3% | 29.7% | 22.8% | 43.4% | 40.4% | 23.1% | 14.0% | 29.0% | 22.8% |
| U.S. Citizen | 61.6% | 60.7% | 68.3% | 43.4% | 47.0% | 70.9% | 82.9% | 63.8% | 75.5% |
| Living in same unit in 2011 | 56.5% | 56.0% | 62.6% | 43.4% | 46.1% | 59.8% | 72.2% | 53.7% | 68.9% |
| Percent High School Graduate | 81.6% | 81.0% | 77.5% | 86.4% | 85.4% | 81.3% | 72.8% | 86.7% | 86.2% |
| Percent BA/BS or more | 17.0% | 17.4% | 16.3% | 13.1% | 22.2% | 14.0% | 13.6% | 15.7% | 12.1% |
| Speaking only English | 25.0% | 24.1% | 30.6% | 17.1% | 20.3% | 27.2% | 23.5% | 32.5% | 32.6% |
| Speaking Chamorro | 18.6% | 17.2% | 19.0% | 5.2% | 6.6% | 31.4% | 39.3% | 23.5% | 37.8% |
| Speaking Filipino language | 36.3% | 37.2% | 30.1% | 54.1% | 49.7% | 27.8% | 15.6% | 32.8% | 23.6% |
| In the labor force | 70.0% | 69.8% | 67.3% | 72.5% | 74.5% | 64.6% | 64.9% | 69.6% | 74.9% |
| Unemployed | 12.8% | 12.9% | 13.0% | 16.8% | 12.4% | 14.3% | 10.0% | 21.6% | 2.0% |
| Working for Private company | 81.2% | 83.4% | 82.2% | 94.7% | 88.8% | 73.6% | 68.0% | 65.9% | 56.3% |
| Working for CNMI government | 16.6% | 14.8% | 15.6% | 4.0% | 10.0% | 26.3% | 28.7% | 28.9% | 36.8% |
| Service occupations | 30.9% | 31.2% | 25.0% | 38.4% | 34.6% | 27.6% | 29.7% | 28.9% | 28.1% |
| Hotel and food industry | 23.3% | 24.7% | 18.1% | 30.5% | 27.9% | 27.6% | 23.1% | 11.1% | 10.2% |
| Persons in Poverty | 55.7% | 56.3% | 59.5% | 66.0% | 57.4% | 38.6% | 47.4% | 54.3% | 47.5% |
HIES 2016
To download, right click on the chart and select “Save Image As”…