


HIES 2016 HOUSING
HIES 2016
HOUSING
The 2005 and 2016 both asked a series of housing questions, with most of the items being the same in the two enumerations. The type of housing often shows wealth, and in many countries zoning requires different types of housing, and housing separate from commercial endeavors. The CNMI, however, does not have Western-style zoning, so housing is not consistent within a small area. Traditionally, housing was only “owned”, not rented, but with foreigners in the Commonwealth, and some natives also not having access to their own housing, renting has been very frequent in recent years.
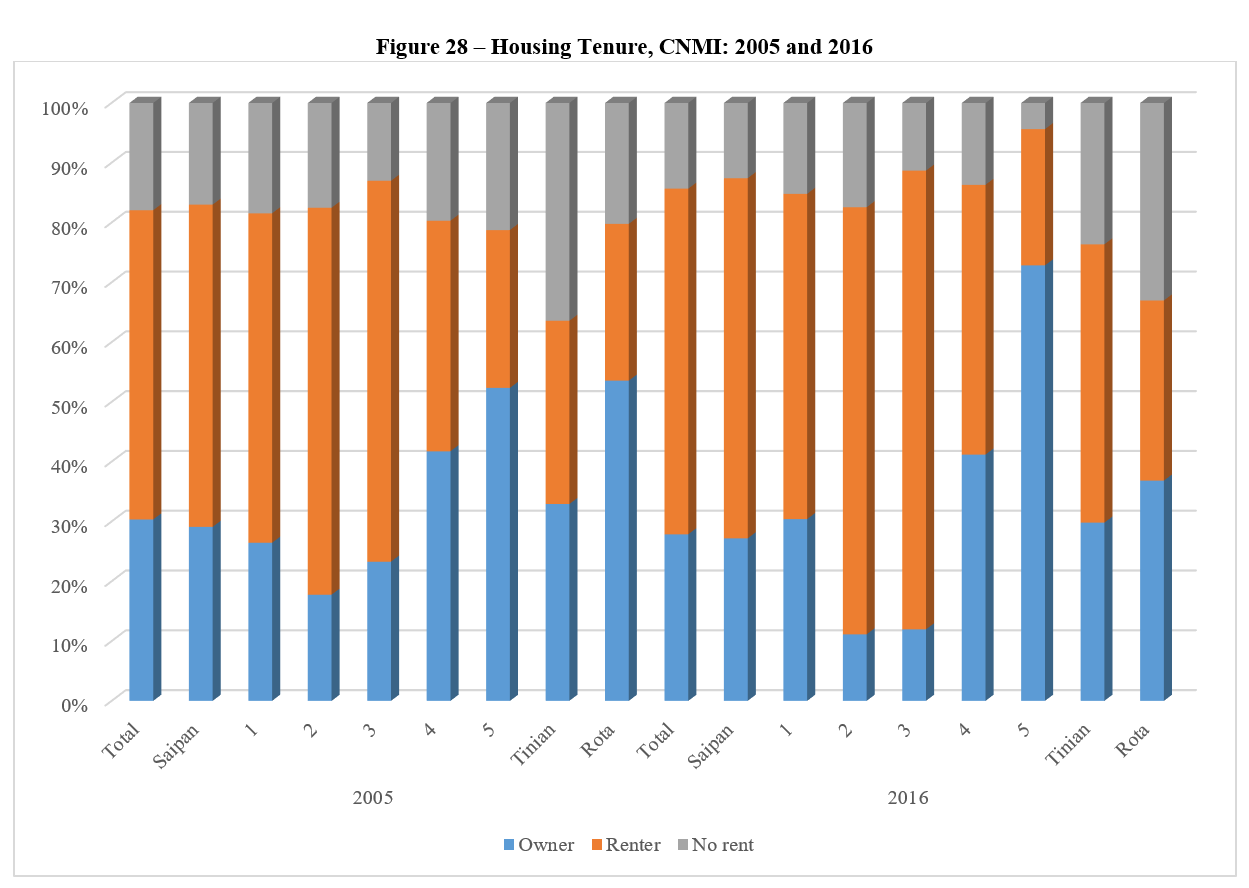
About half of all units in the CNMI were rented in 2005 and a larger percentage were rented in 2016, particularly in Districts 2 and 3. Rota had the smallest percentage of rented; District 5 had the highest percentage of owner-occupied units.
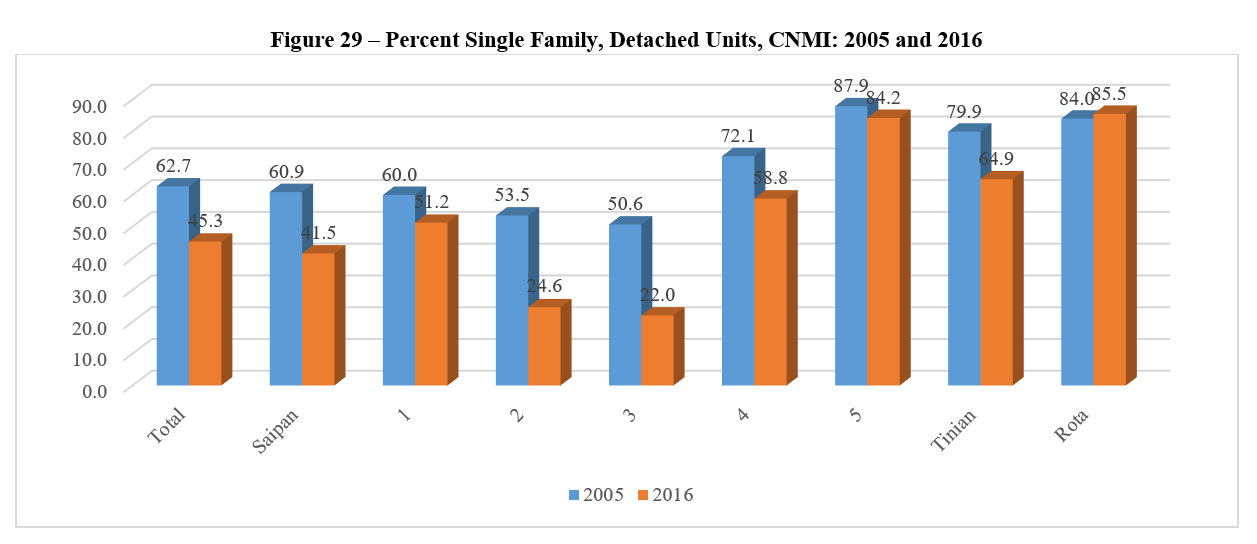
Between 2005 and 2016 more families moved into apartment and other multiple family dwellings. While 63 percent of the housing units were single-family detached units in 2005, but that decreased to just 45 percent in 2016. A detached unit is not attached to any other housing unit or business; so, if a mom and pop store is at the front of the housing unit, that unit is not considered detached. The percentage living in single-family detached housing units in Rota increased slightly to about 86 percent, but all other districts and Tinian decreased during the period. In District 3, for example, the percentage living in single family detached units decreased from about half in 2005 to less than 1 in 4 in 2016. The largest percentage living in single-family units was District 5, with 88 percent in 2005 decreasing only slightly to 84 percent in 2016.
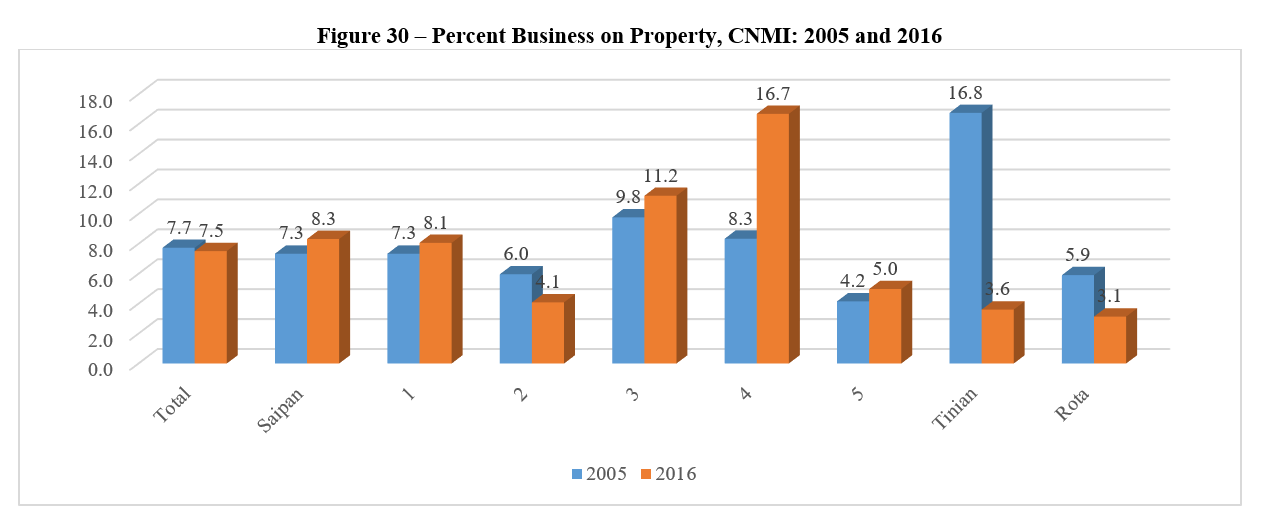
The percent of units with businesses attached stayed about the same in 2016 as in 2005, at about 8 percent of the units. A business could be a mom and pop store or a doctor’s office or poker place or some other commercial enterprise. Some of the numbers seem somewhat suspect. According to the surveys, about 17 percent of the Tinian units in 2005 had a business decreasing to about 4 percent in 2016; and about 8 percent of the District 4 units had a business in 2005 but that increased to 17 percent in 2016. About 8 percent of the Saipan units in 2016 were attached to a business compared to 4 percent for Tinian and about 2 percent for Rota.
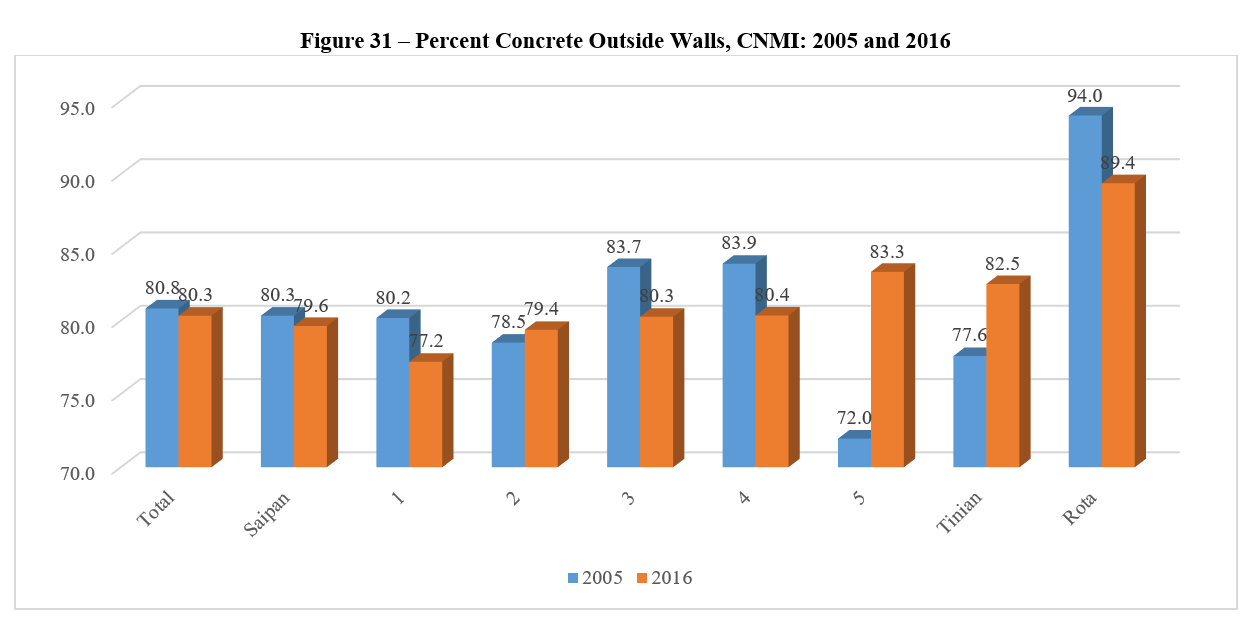
About 4 in every 5 units had poured concrete or concrete block walls in both 2005 and 2016. About 9 in 10 of Rota’s units were concrete walled but this value had decreased from 2005. The percentage of units with concrete walls increased from 72 to 83 percent in District 5 and from 78 to 82 percent on Tinian. Most of the others saw small increase or decreases over time.
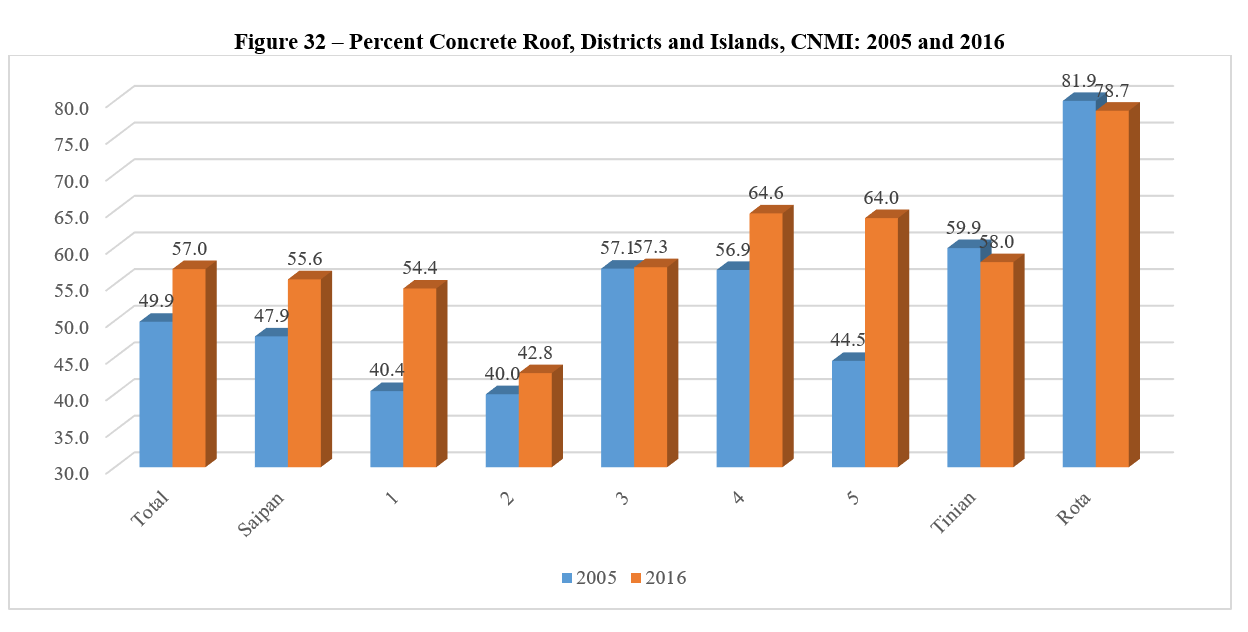
About half the roofs in 2005 were made of poured concrete, but that percent increased to 57 percent in 2016. About 4 in every 5 of Rota’s units in both surveys had concrete roofs, and about 3 of 5 for Tinian. About 2 in 3 of the units in Districts 4 and 5 had concrete roofs compared to only 2 in 5 for District 2 and about half of those in Districts 1 and 3.
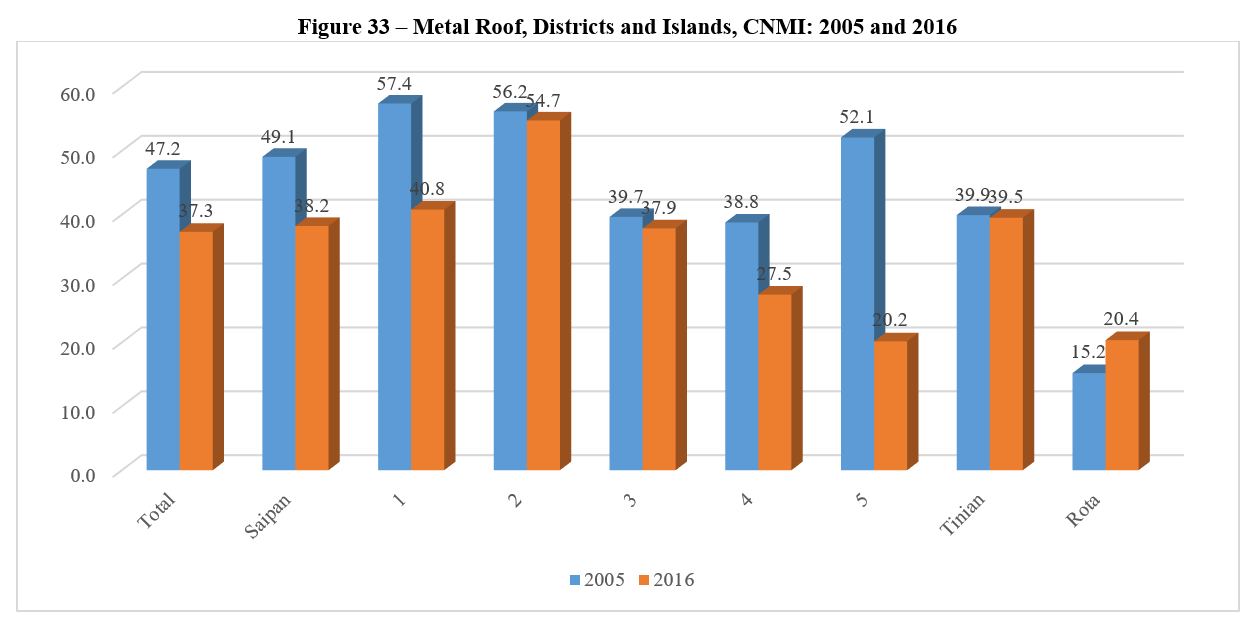
Most of the rest of the roofs were made of metal. The percent of units having metal roofs decreased from 47 to 37 percent during the 11 years. About 2 in 5 of Tinian’s roofs were metal in 2016 compared to about 1 in 5 for Rota. More than half the units in Districts 1,2, and 5 had metal roofs in 2005, but by 2016 all except District 2 saw large decreases. In 2016, only 1 in 5 of the District 5 units had metal roofs.
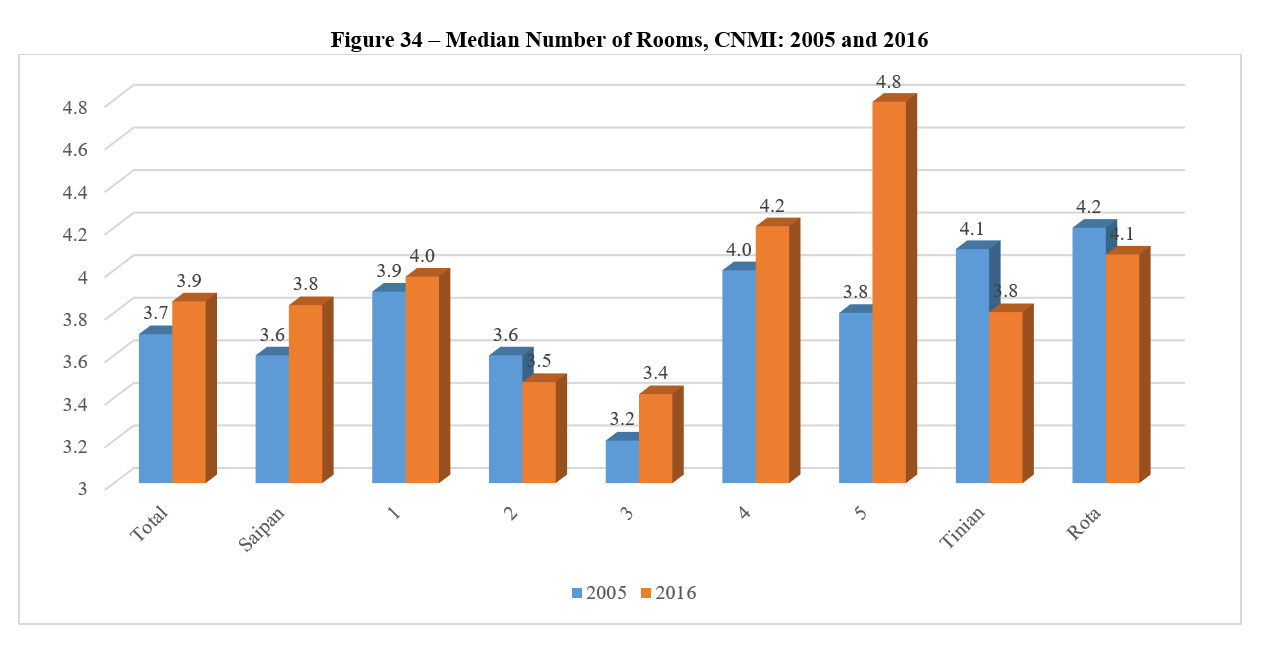
The median number of rooms did not change very much between 2005 and 2016, increasing from about 3.7 to 3.9 during the period, around 4 rooms per unit. The size of housing units increased by about 1 room during the period in District 5, but otherwise the changes were small, with Tinian and Rota decreasing a little.
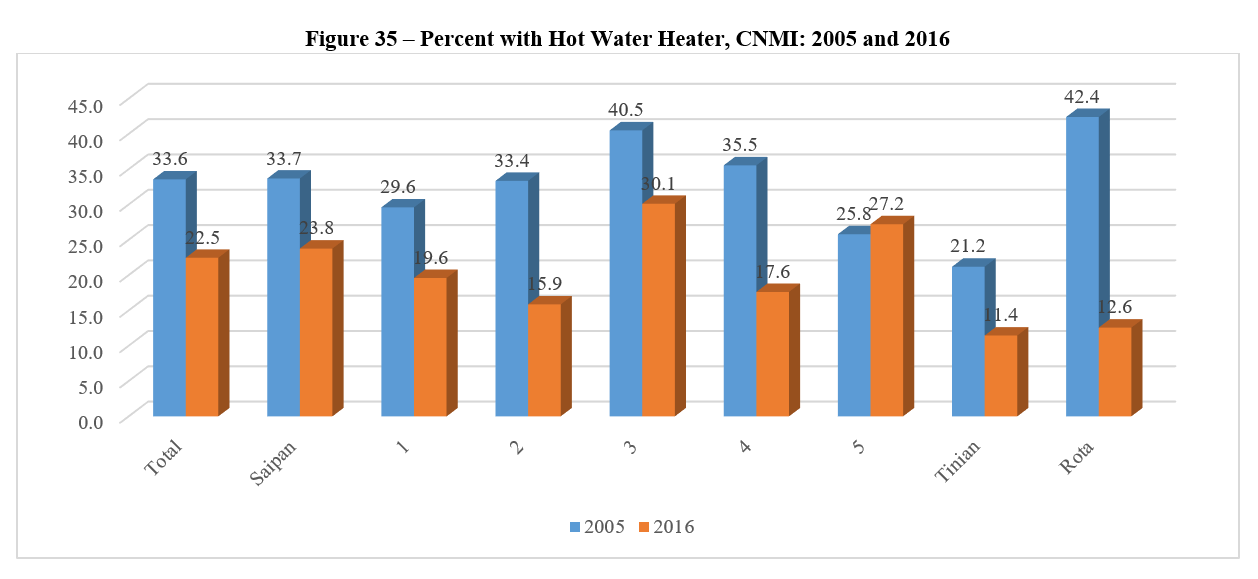
Hot water is not considered a necessity in the CNMI because the climate is already so hot. And, heating the water can be very expensive. So, while about 1 in 3 units in 2005 had hot water, this was true for only about 1 in 4 in 2016. Rota saw the biggest decrease, from 42 percent to 13 percent. Tinian and most of the districts also saw decreases. However, District 5 had a slight increase.
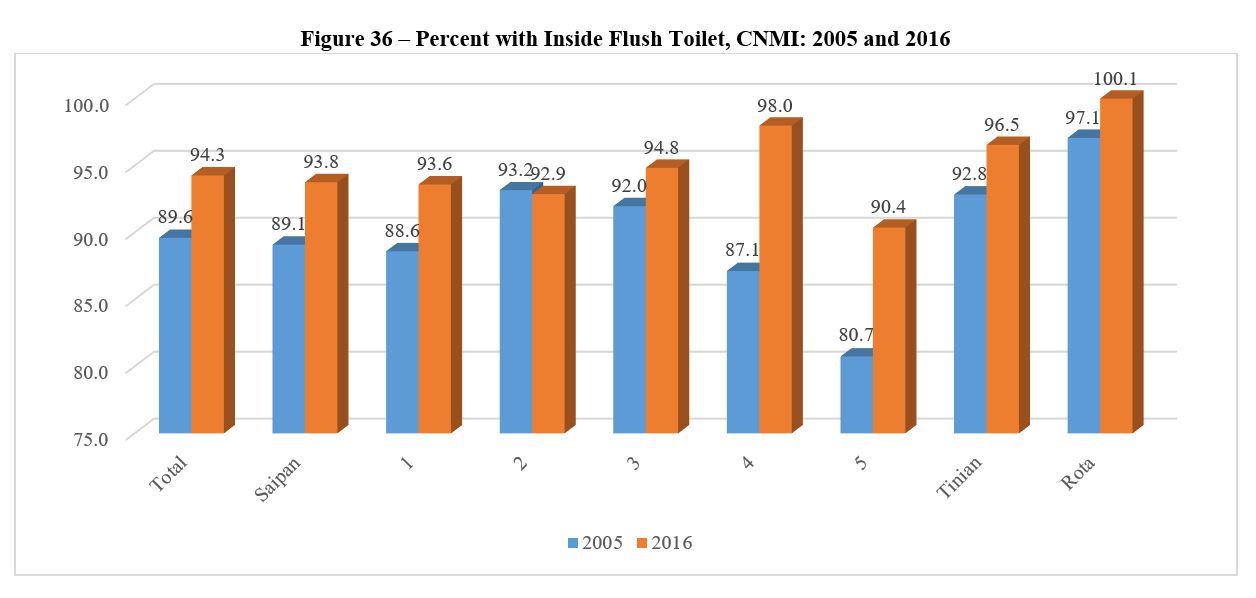
As CNMI has come into the 21st century, almost all units now have flush toilets. When the huge influx of foreign workers came in during the 1990s and early 2000s, some sub-standard housing was built and occupied, but now many units are vacant. Most of the remaining units have toilets. The percentage of units with an inside flush toilet increased from 90 to 94 percent between 2005 and 2016. All of Rota’s selected units in the survey had at least one flush toilet as did 97 percent of those on Tinian. District 4 was the most likely to have a flush toilet, at 98 percent, up from 87 percent 11 years before. All Districts saw more than 90 percent of the units with a flush toilet.
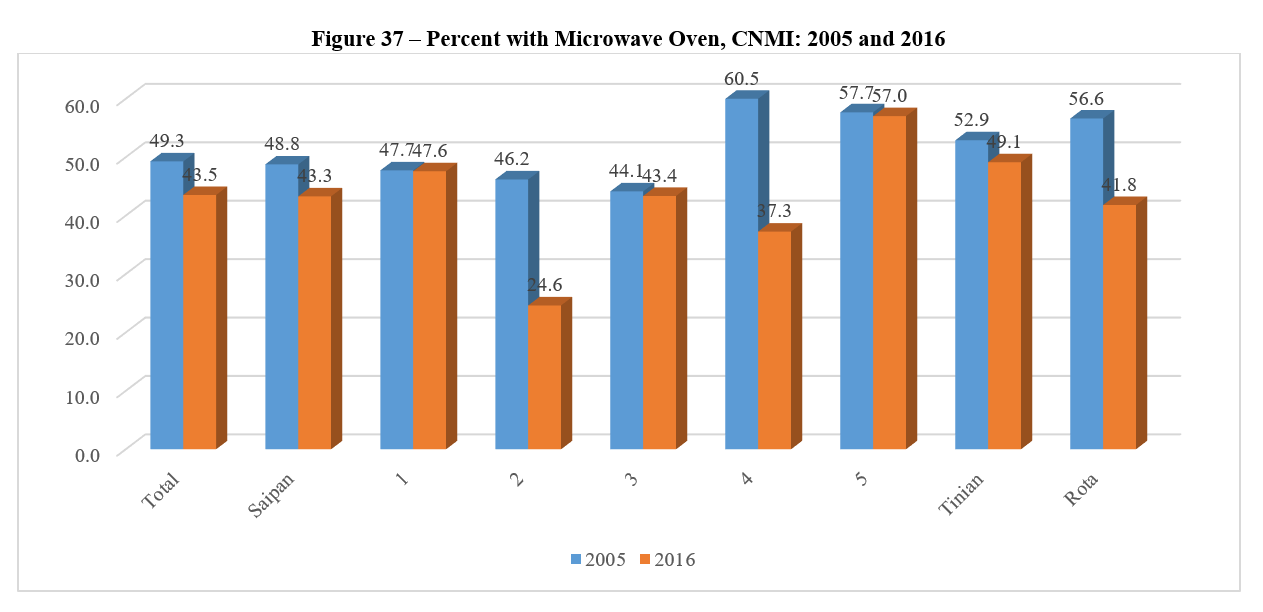
Having a microwave oven is both an indicator of wealth – although they have become cheaper and cheaper – and as an energy using source. The percentage of units with microwave ovens went down between 2005 and 2016, from about 49 percent to 44 percent during the period. Every District and Rota and Tinian all saw decreases.
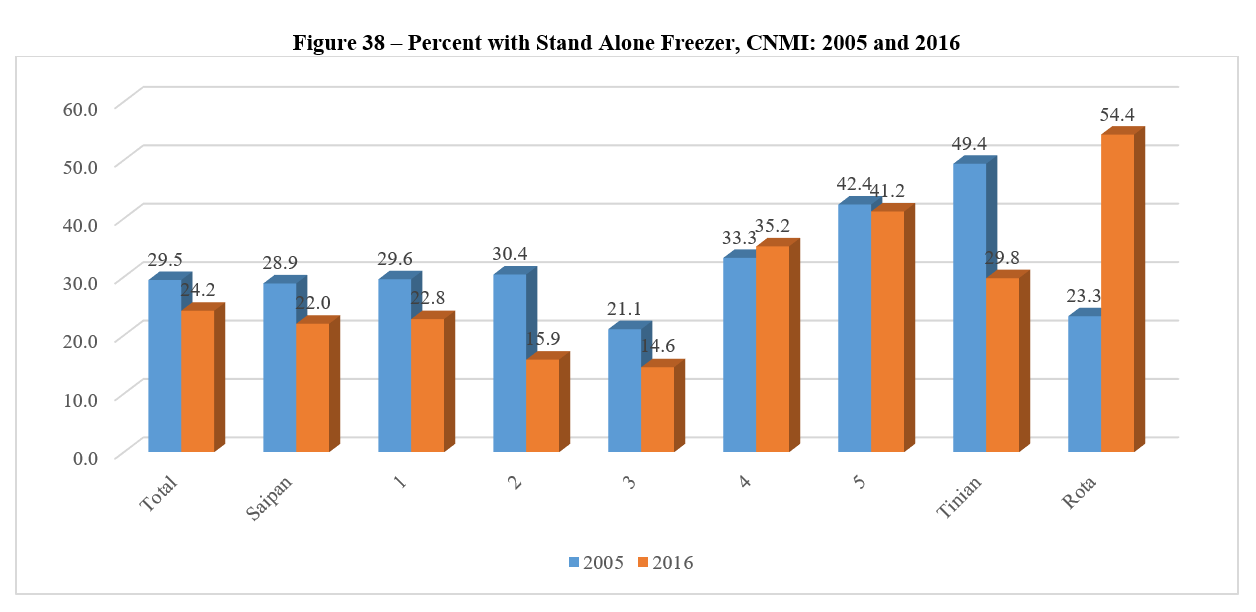
A stand-alone freezer is also both a wealth indicator and an energy user. The percentage of units with a freezer decreased during the period, from 30 to 24 percent. All the Districts and Tinian saw decreases (for Tinian the percent went from 49 to 30). However, the percentage of units with freezers on Rota increased from 23 percent in 2005 to 54 percent in 2016, more than doubling as a percent.
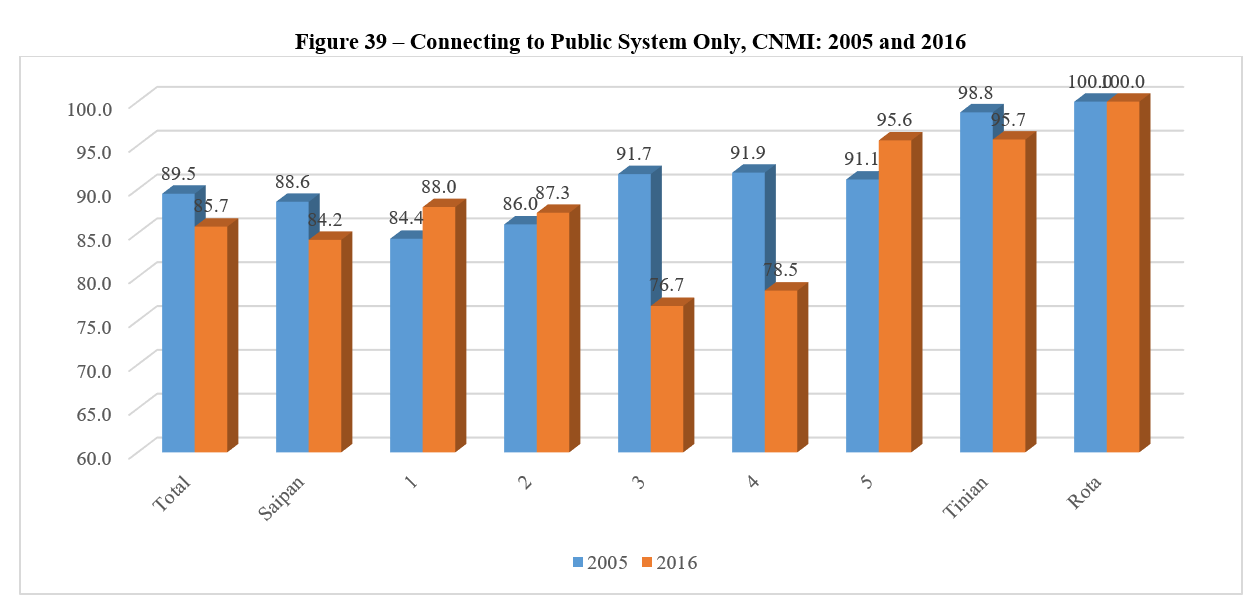
The questionnaire asked whether the unit was connected to a public system to get water, or whether it was connected to a public system but also had some auxiliary method of obtaining water. Most of the units were connected to the public system only. All the units on Rota were connected and about 96 percent of those on Tinian. But, only about 3 in 4 units in districts 4 and 5 were connected to the public system.
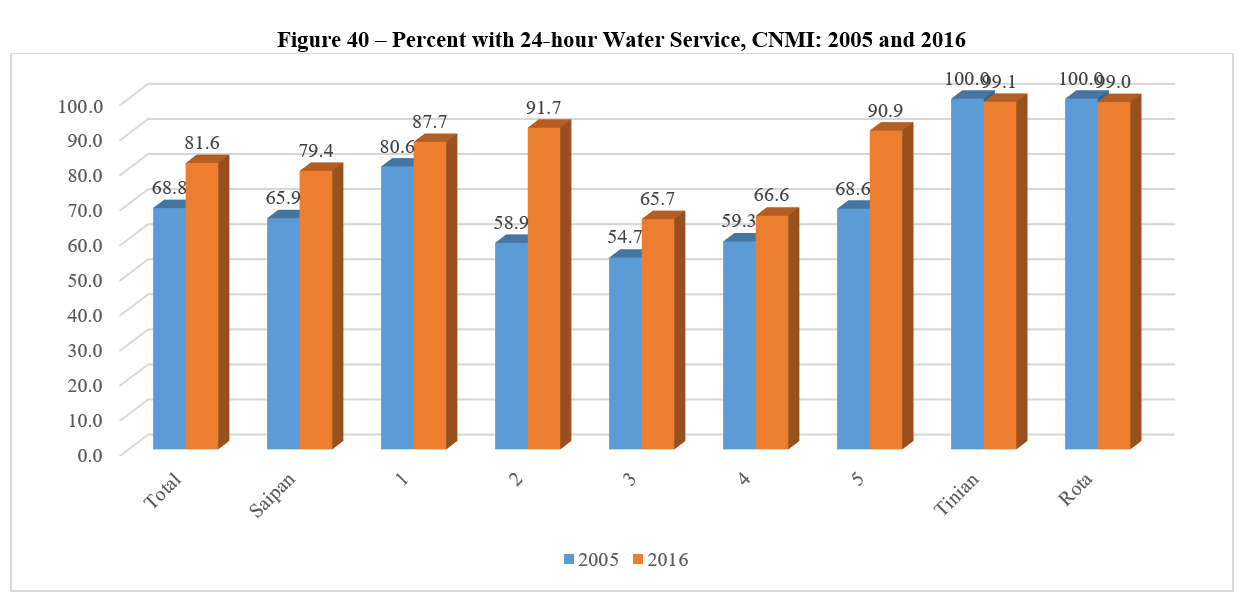
The percentage of units getting 24-hour water service increased from 69 to 82 percent during the 11 years between surveys. Almost all the units on Tinian and Rota had 24-hour service, and about 4 in every 5 of Saipan’s unit had complete daily service. However, only about 2 in every 3 of the units in Districts 3 and 4 had 24-hour service, pulling down the Saipan average.
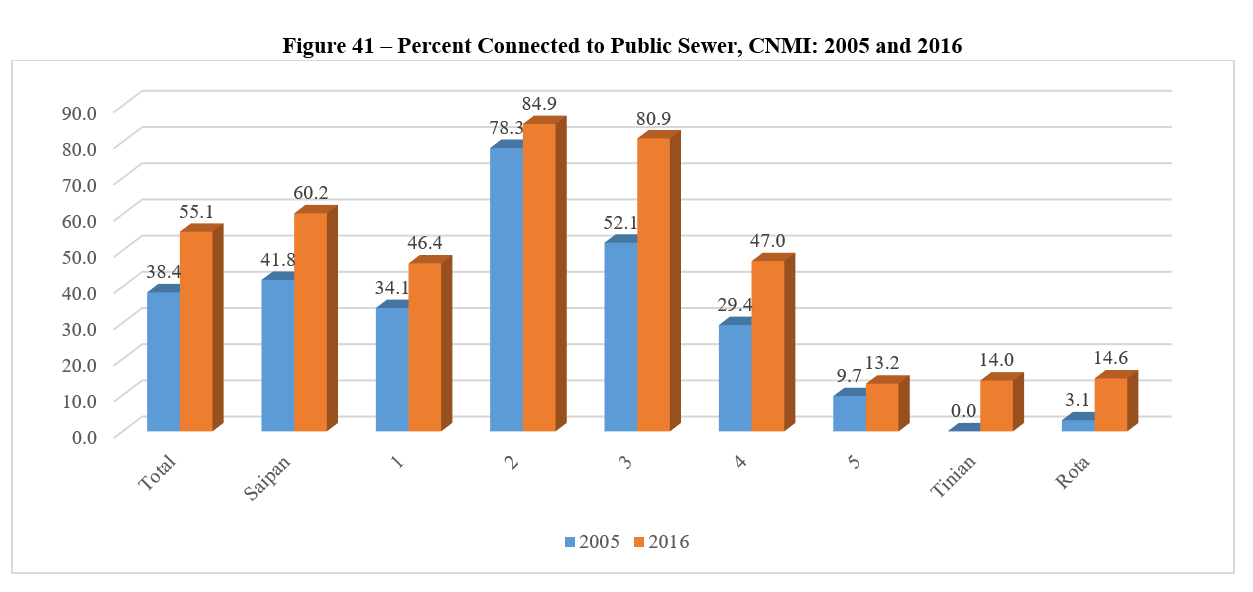
About 1 in every 4 housing units in the 2005 household survey were connected to a public sewer, but by 2016, more than 55 percent were connected. As would be expected, connections for Rota and Tinian were much lower, at 14 percent for Tinian and 15 percent for Rota in 2016. Almost 85 percent of the units in District 2 were connected to the public sewer, as were 81 percent of those in District 3. However, only 13 percent of the units in District 5 had that connection. Those units not connected to the sewer system had to continue to use cesspools or septic tanks.
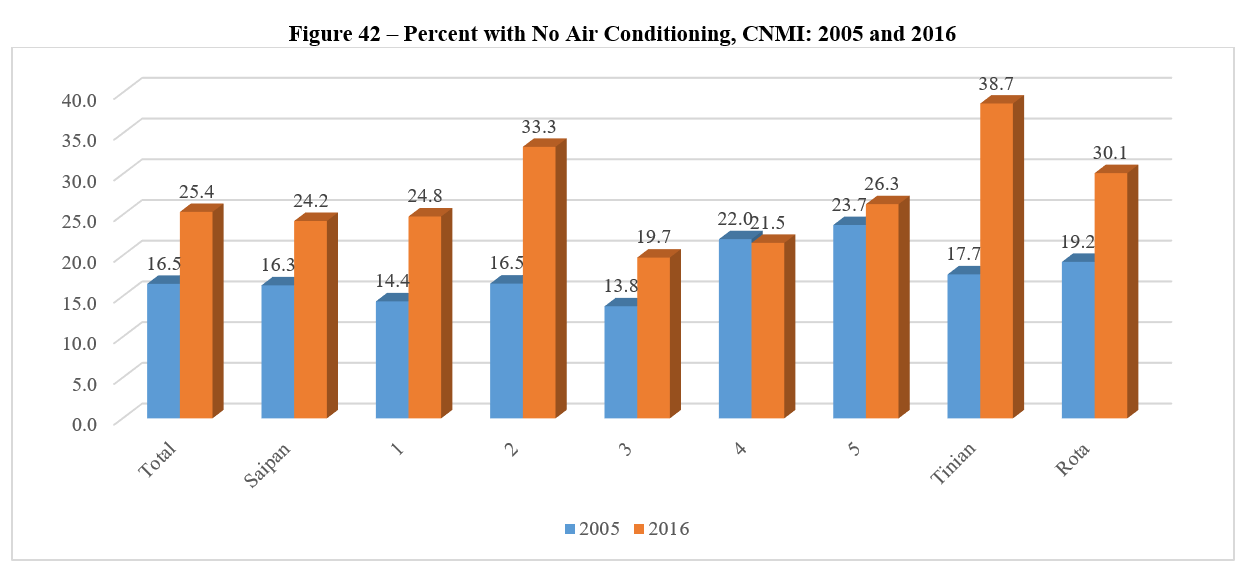
Air conditioning has only come to CNMI in more usage recently. In 2005, only 1 in 6 units had air conditioning, but by 2016, 1 in 4 units had either room air conditioners or central air conditioning. The amount of air conditioning has an impact on the public utilities, so this may be considered for government planning. While about 30 percent of Rota’s units in 2016 had air conditioning, as much as 39 percent of Tinian’s unit did, as did 24 percent of Saipan’s units. About 1 in every 3 of the units in District 2 had air conditioning, compared to 1 in 7 for District 1 and 20 percent for District 3.
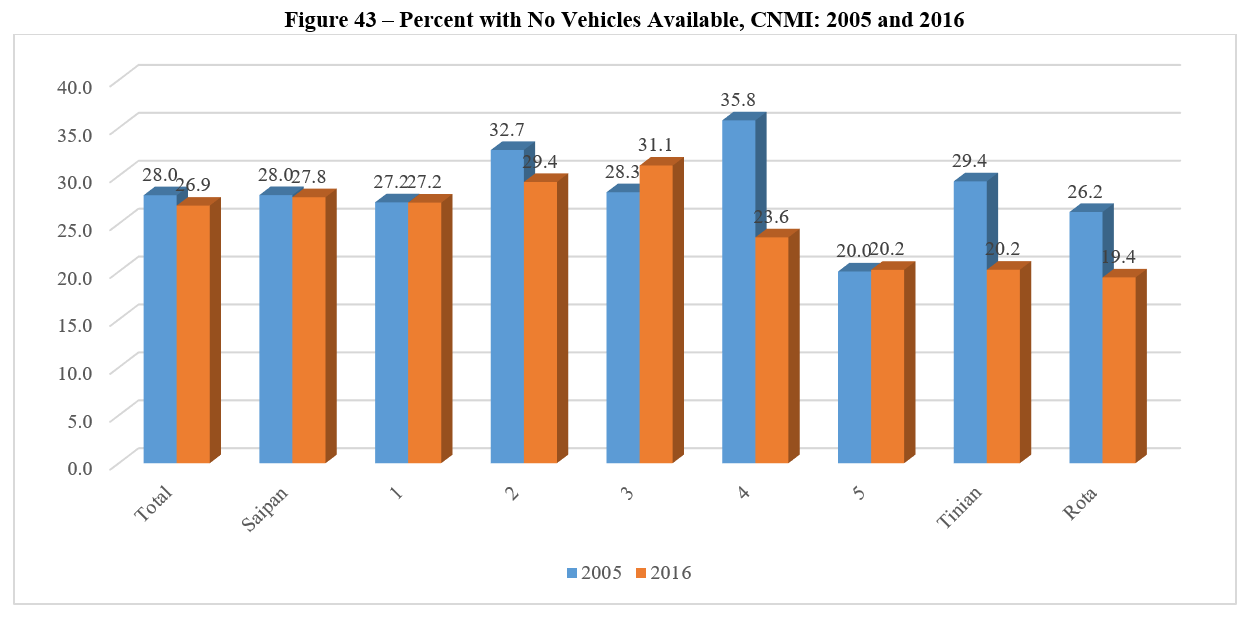
The percentage of units with no vehicle available stayed about the same over the 11 years, at about 27 percent in 2016 on Saipan. The percentages of units in Tinian and Rota, however, decreased – from 29 to 20 percent for Tinian and 26 to 19 percent for Rota, meaning more units had cars. While Districts 2 and 4 saw an increase in percentage in the percent with cars, District 3 saw an increase in units without a vehicle.
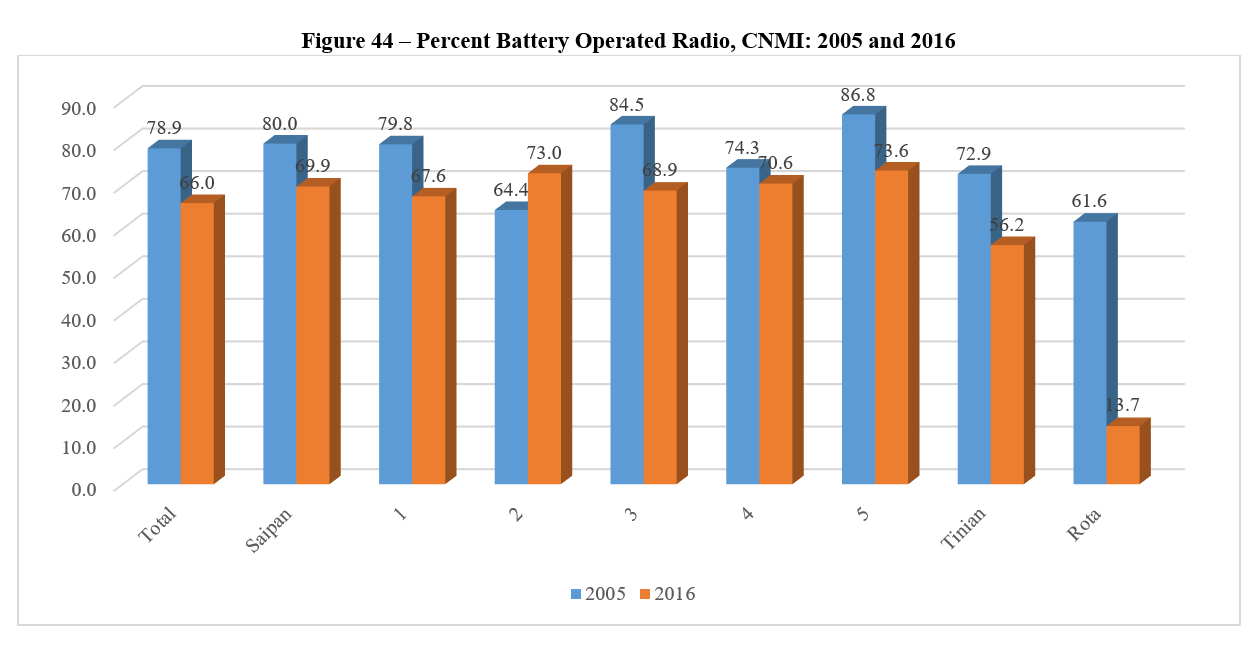
The percent with a battery-operated radio decreased during the period, probably because of the increased use of smart phones. Traditionally, battery operated radios were needed in times of disasters, but cell phones now serve that purpose. Most of the units, except on Rota in 2016, continued to have radios.
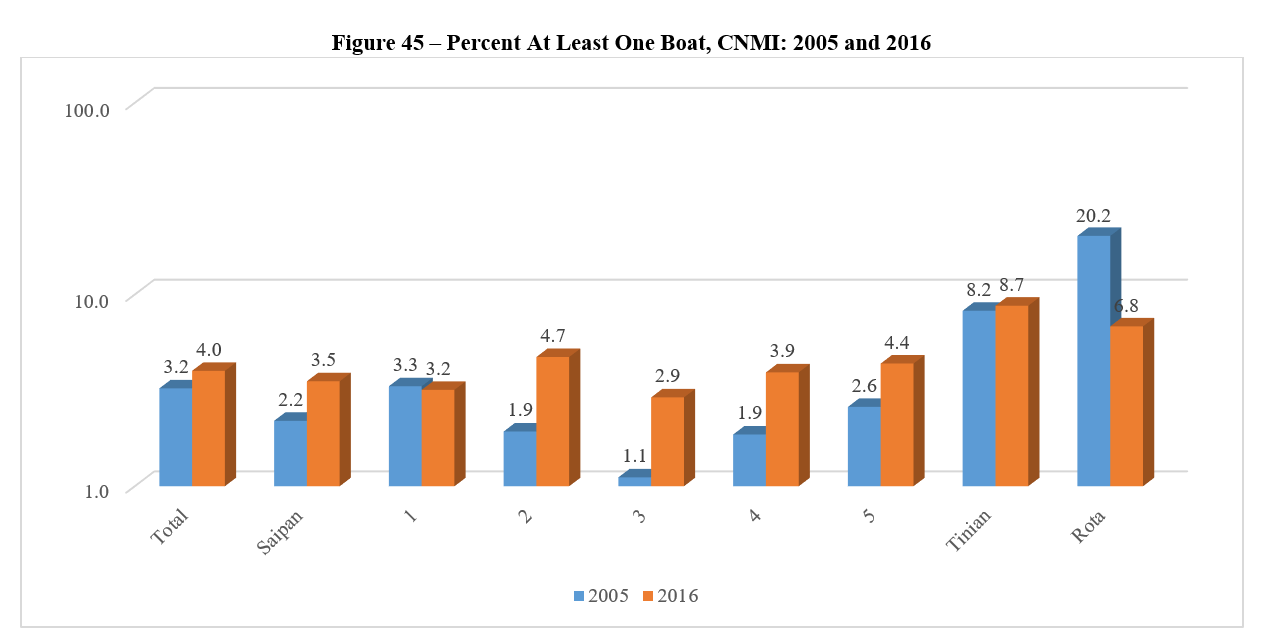
For some households, a boat is a necessity as they use it for fishing for subsistence. However, most units did not have a boat, either in 2005 or 2016. The percentage with a boat increased only from 3 to 4 percent. About 1 in every 5 units on Rota had a boat in 2005 but that decreased to less than half in 2016. All the others had only small percentages with boats.
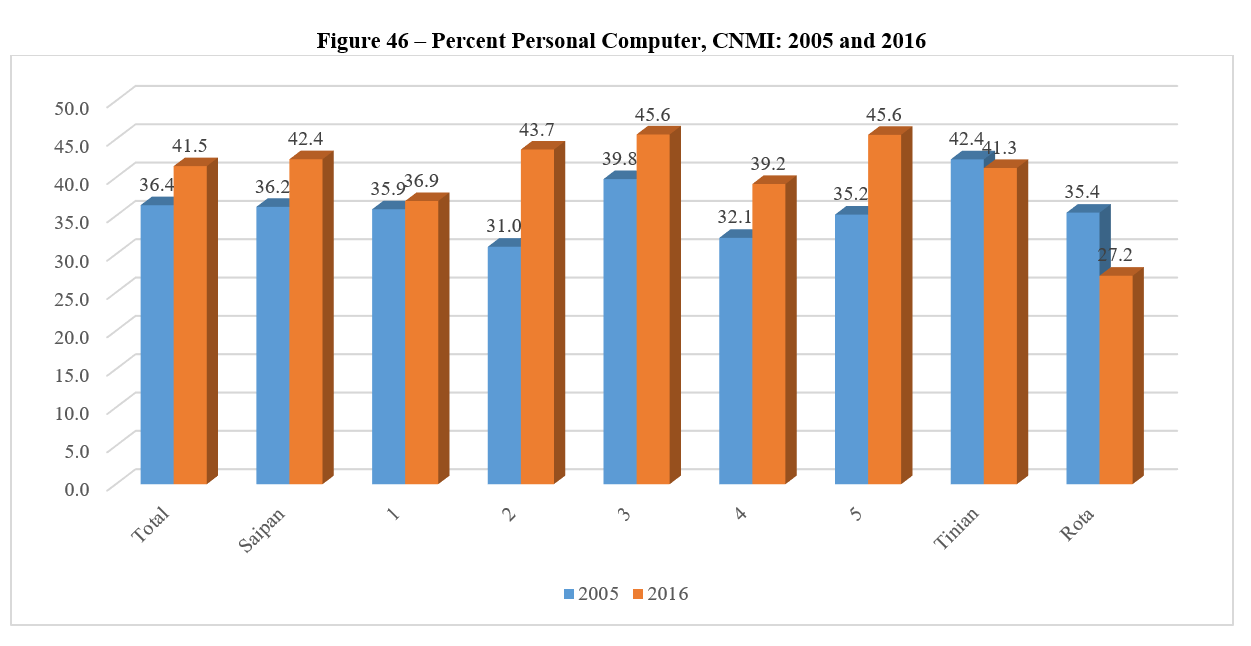
The percentage of units with a personal computer (including laptops and notebooks) increased from 36 percent in 2005 to 42 percent in 2016. While all the Districts on Saipan saw increases in personal computers, Tinian had a small decrease and Rota had a more substantial decrease, since that only 27 percent, slightly more than 1 in 4 units, had a personal computer.
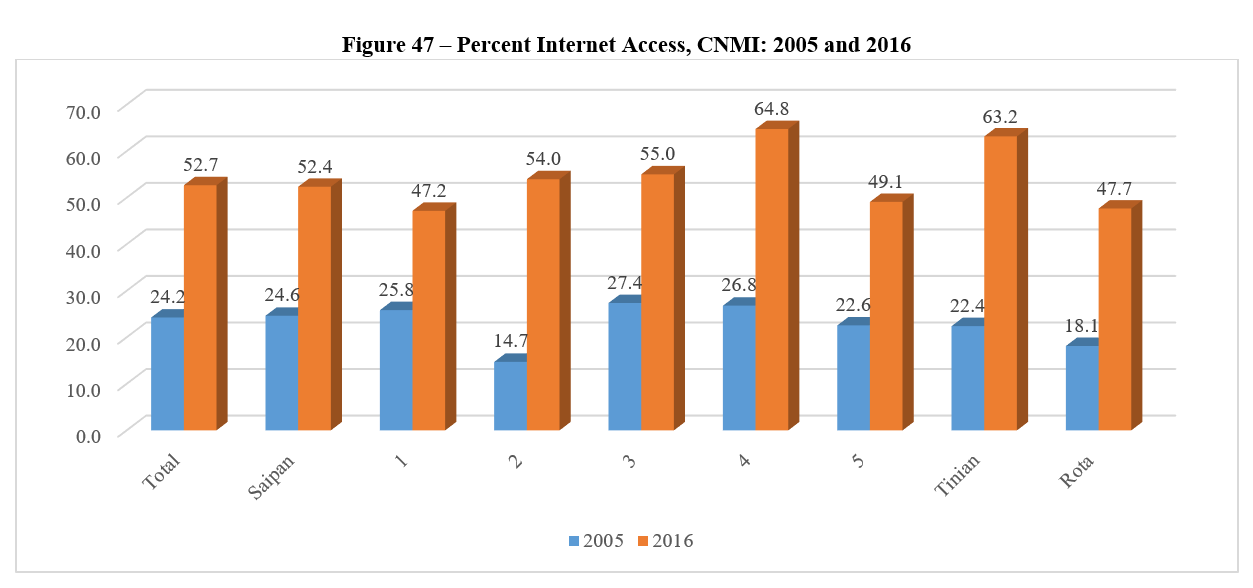
The internet was still relatively young in 2005 during the first of these two surveys. So, only about 1 in 4 of the households had internet access. The distribution was even across the districts and islands. District 2 had the lowest attachment, at 15 percent, followed by Rota at 18 percent. But by 2016, about half the housing units had internet access. Almost 2 out of every 3 housing units in District 4 had internet access, followed by Tinian, at 63 percent. While Districts 1 and 5 and Rota had the lowest internet access, even for them, about half the units had internet access in 2016.
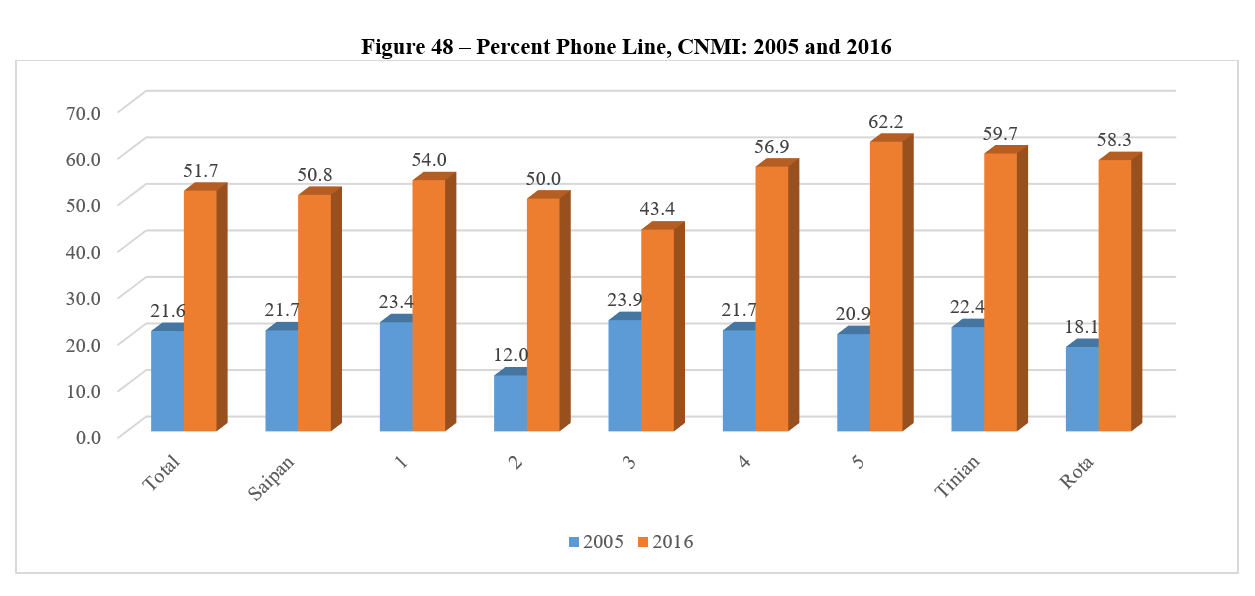
In 2005, cell phone use was not as common as it is now, particularly smart phones, so households had landlines if they could get them. With increasing cell phone use, some units are moving away from landlines. Nonetheless, in CNMI landline use increased over the period. While about 1 in 5 units had a landline in 2005, about half of the units had a phone in 2016. Only in District 3 did fewer than half of the units have a landline. District 5 saw about 62 percent with a landline.
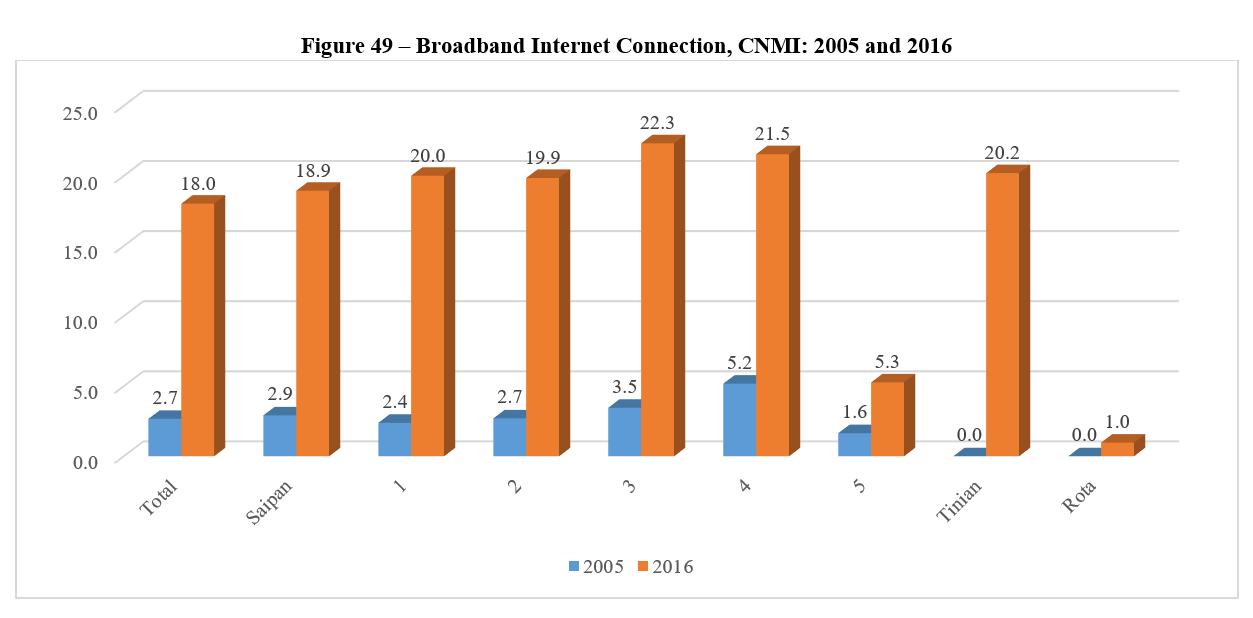
The percentage of units connected to the internet by broadband increased significantly during the 11 years. In fact, in 2005 almost no units were connected via broadband. By 2016, about 1 in every 5 units was connected. Rota continued to have almost no broadband connection, but Tinian’s was among highest use percentage-wise. Less than 5 percent of the District 5 units were connected to the internet, but the other districts had used about the same as for Saipan.
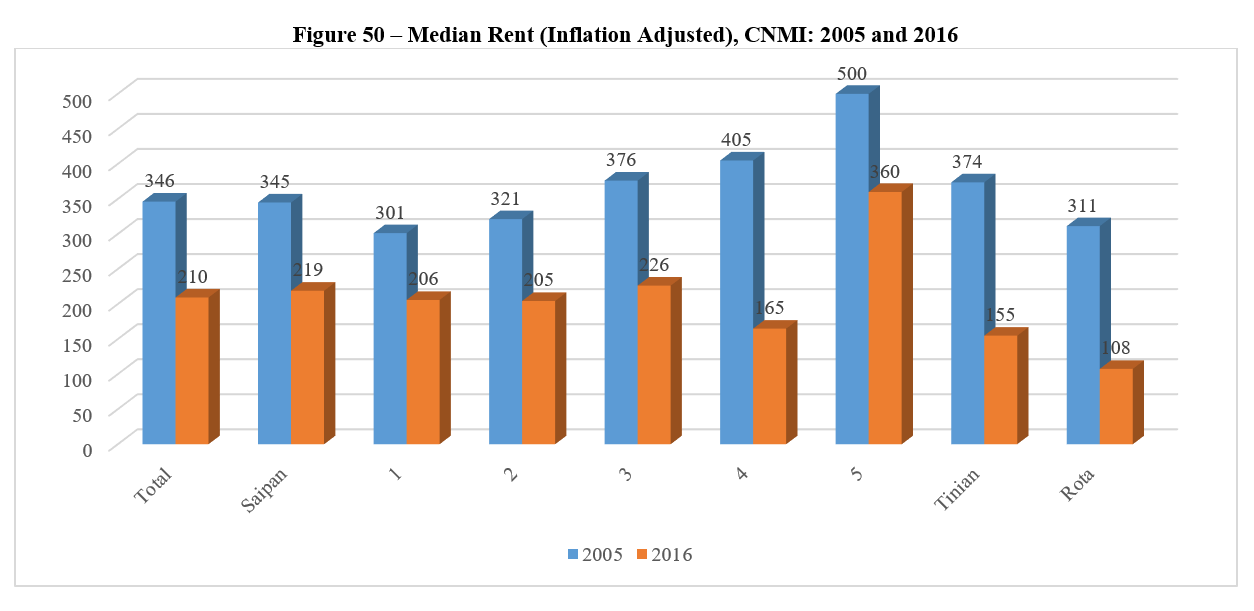
For median rent paid, we have the same problem as for the population income variables. We are forced to use the U.S. standard for inflation between the two survey years. Hence, while it looks like all Districts and Tinian and Rota seem to have decreases in rent – and this makes sense since there was less pressure on rental resources with so many people leaving the Commonwealth, the trends may be obscured by lack of knowledge of the true inflation rate for the CNMI between the enumerations.
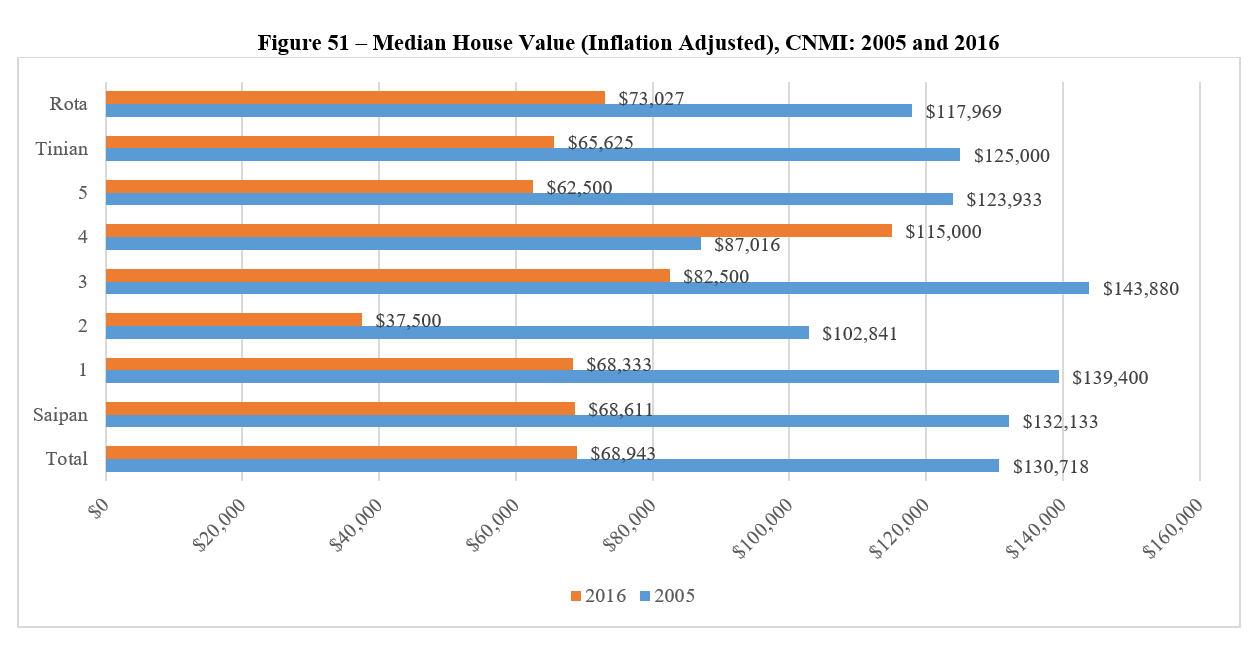
Similarly, for value of unit. While the chart shows a significant decline in the value of units, from about $120,000 in 2005 to about $60,000 in 2016, adjusted for inflation, it is not clear whether we have the correct inflation factor. Nonetheless, it is very likely that the value of housing did decline in the period because of the out-migration. All Districts and Tinian and Rota saw decreases in the median value of housing.
Table 2 shows payments appearing as part of the housing questionnaire. The numbers of cases, total amounts paid, and averages are shown for CNMI total and for the three islands. Data for the Districts are available in the available in the Central Statistics Office. As would be expected, the largest amounts were for the values of house. The average value in 2016 was $91,000, which was a decrease from 2005 when the larger population put more demands on the housing market. The average unit on Saipan was worth $96,000 compared to $75,000 on Tinian and $74,000 on Rota. Monthly rent also was lower than in 2005, at $238 for the Commonwealth, with Saipan slightly higher and Tinian and Rota much lower.
Table 3 shows comparisons between the 2005 Household Survey and the 2016 Survey. The numbers do not account for inflation during the 11 years, or the differences would be even greater. But, in general, there was only a small increase or decrease between the two enumerations. The monthly cost of a cellular phone decreased more than most of the other items on the list. And, the mortgage payment was much lower since the cost of a house decreased during the period.
HIES 2016
HIES 2016 Table 2. Housing Payments by Island, CNMI: 2016
Household Income and Expenditures Survey 2016 CNMI CSD
HIES 2016 Table 2. Housing Payments by Island, CNMI: 2016
Table Data:
| Housing Payment | CNMI Units | CNMI Amount | CNMI Per unit | Saipan Units | Saipan Amount | Saipan Per unit | Tinian Units | Tinian Amount | Tinian Per unit | Rota Units | Rota Amount | Rota Per unit |
|---|---|---|---|---|---|---|---|---|---|---|---|---|
| Monthly rent | 596 | $141,788 | $238 | 512 | $130,458 | $255 | 53 | $8,305 | $157 | 31 | $3,032 | $98 |
| Phone bill | 560 | $23,856 | $43 | 432 | $18,533 | $43 | 68 | $3,869 | $57 | 60 | $1,488 | $25 |
| Electric bill | 865 | $104,060 | $120 | 680 | $84,660 | $125 | 94 | $11,506 | $122 | 91 | $7,917 | $87 |
| Cable TV Bill | 406 | $25,213 | $62 | 344 | $22,119 | $64 | 33 | $2,211 | $67 | 29 | $853 | $29 |
| Internet bill | 559 | $30,633 | $55 | 440 | $23,584 | $54 | 70 | $4,592 | $66 | 49 | $2,450 | $50 |
| Cell phone bill | 972 | $63,666 | $66 | 786 | $53,841 | $69 | 101 | $4,848 | $48 | 85 | $4,879 | $57 |
| Gas bill | 988 | $31,814 | $32 | 797 | $25,026 | $31 | 100 | $3,690 | $37 | 91 | $3,121 | $34 |
| Water bill | 900 | $48,510 | $54 | 699 | $38,375 | $55 | 105 | $5,471 | $52 | 96 | $4,637 | $48 |
| Solid waste | 326 | $6,716 | $21 | 311 | $6,344 | $20 | 7 | $185 | $26 | 8 | $190 | $24 |
| House Value | 302 | $27,564,416 | $91,273 | 232 | $22,324,710 | $96,227 | 34 | $2,563,121 | $75,386 | 36 | $2,676,578 | $74,349 |
| Mortgage | 60 | $31,470 | $525 | 50 | $28,095 | $562 | 4 | $1,590 | $398 | 6 | $1,780 | $297 |
HIES 2016 Table 3.Selected Housing Expenditures, CNMI: 2016
Household Income and Expenditures Survey 2016 CNMI CSD
HIES 2016 Table 2.Selected Housing Expenditures, CNMI: 2016
Table Data:
| Expenditure | Number | Annual Amount Spent | Average |
|---|---|---|---|
| House rent | 5,647 | $1,838,232 | $326 |
| Telephone bill | 9,178 | $432,932 | $47 |
| Electricity | 10,809 | $1,422,627 | $132 |
| Cable TV | 7,456 | $340,614 | $46 |
| Internet bill | 2,416 | $126,106 | $52 |
| Cellular telephone | 129 | $17,830 | $138 |
| Gas bill | 7,791 | $199,518 | $26 |
| Water bill | 9,872 | $378,282 | $38 |
| Mortgage interest payment | 578 | $1,261,115 | $2,182 |
HIES 2016 Table 3.Selected Housing Expenditures, CNMI: 2005
Household Income and Expenditures Survey 2016 CNMI CSD
HIES 2016 Table 3.Selected Housing Expenditures, CNMI: 2005
Table Data:
| Expenditure | Number | Annual Amount Spent | Average |
|---|---|---|---|
| House rent | 6,260 | $2,013,229 | $322 |
| Telephone bill | 10,959 | $525,966 | $48 |
| Electricity | 12,913 | $1,674,804 | $130 |
| Cable TV | 8,965 | $415,673 | $46 |
| Internet bill | 2,798 | $138,378 | $49 |
| Cellular telephone | 150 | $21,628 | $144 |
| Gas bill | 9,629 | $255,436 | $27 |
| Water bill | 11,976 | $463,666 | $39 |
| Mortgage interest payment | 913 | $2,812,680 | $3,080 |
HIES 2016
To download, right click on the chart and select “Save Image As”…